Traffic Simulation at an Intersection
Contents
Introduction
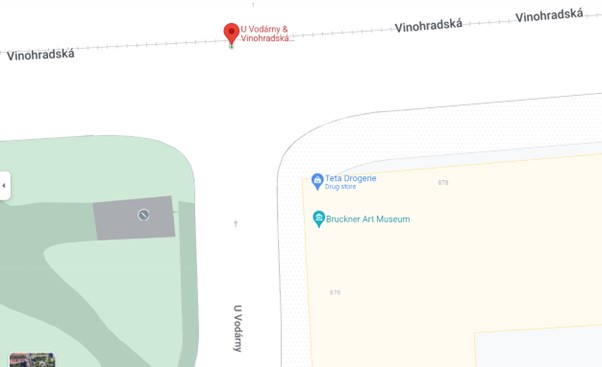
Traffic congestion is one of the major problems in big cities. The intersection traffic signal control problem has become even more crucial in recent years. This simulation deals with one problematic crossroad in Prague (streets U Vodárny and Vinohradská) in which traffic jams occur due to poor organization of traffic. The goal is to reduce the amount of time of cars waiting at the problematic crossroad.
Problem Definition
Traffic jams at intersections result in slower moving vehicles, longer journey times, and increased air pollution. The problem of traffic congestion can have a significant impact on economic productivity, as well as on the quality of life for people living in affected areas.
Tool for the simulation
I've chosen to use NetLogo 6.3.0 as this software is suitable for multi-agent system.
Model
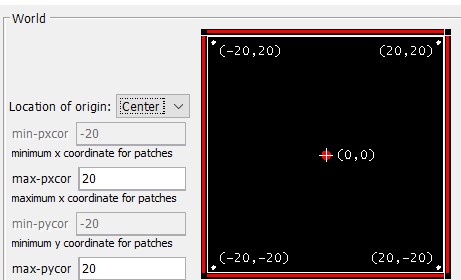
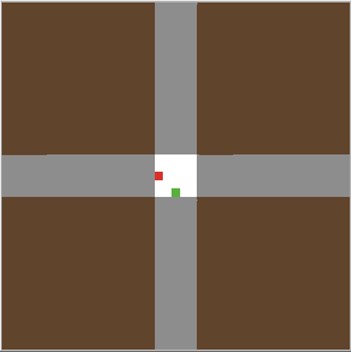
For the goal of this simulation, the intersection of the streets U Vodárny and Vinohradská was simulated. World size was set to {{-20,..,20},{-20,..,20}}. Sidewalks are brown and roads are grey.
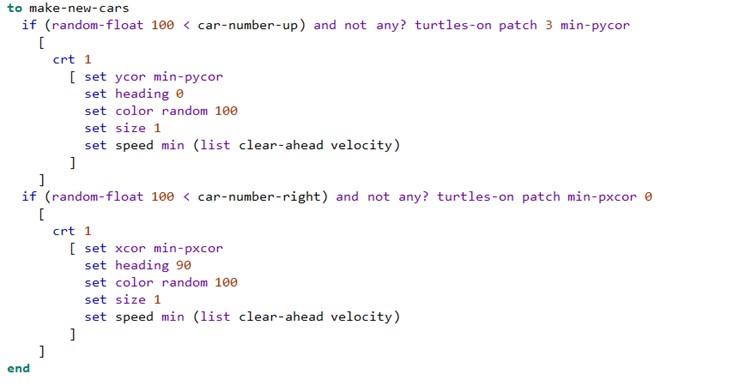
Cars The model contains only one turtle - cars. The code for making new cars is the next:
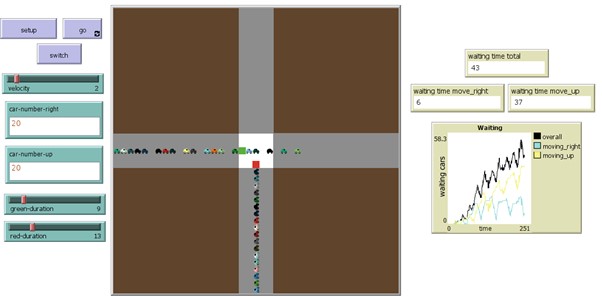
Sliders:
- Velocity - to change the car's speed.
- Green-duration - to change the time of green traffic light.
- Red-duration - to change the time of the red traffic light.
Choosers:
- Car-number-right - field to choose the number of cars that are moving in the east direction.
- Car-number-number-up - field to choose the number of cars that are moving in the north direction.
Results
This section will present how the waiting results will vary with the different traffic light duration.
- Real data from the intersection was collected manually by observation. Manually for morning, afternoon and evening during 10 mins each part of the day within 3 days. The traffic jams were always during the observation time which proves ineffective traffic lights management.
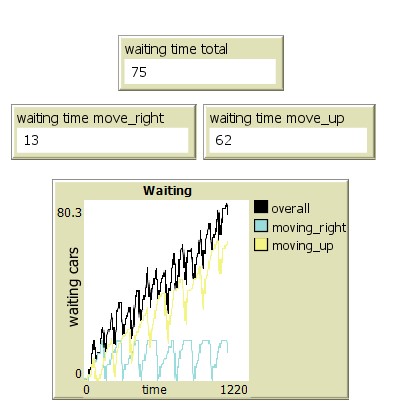
- Real situation simulation:
As we can see from waiting time results - the traffic jam is rapidly increasing with the north direction mostly. And the situation is a little better with the east direction, but still needs improvements.
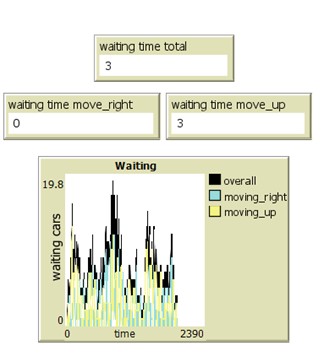
If change the duration of the red light from 63 to 23 seconds and green from 43 to 15 seconds the result will be the next:
Conclusion
Based on the simulation the ideal time for each light was set as 23s for the red light and 15s for the green one. Setting red traffic lights for 23 seconds and green traffic lights for 15 seconds could have a number of potential impacts on traffic flow and safety. One potential benefit is that it could help to reduce traffic congestion by allowing vehicles to move through intersections more quickly. This could also lead to a reduction in air pollution and fuel consumption. However, there are also potential downsides to this approach. For example, shorter green light times could increase the risk of accidents, as drivers may feel rushed to cross the intersection before the light turns red.
Citations
NetLogo 5.1.0 User Manual. Available at: http://ccl.northwestern.edu/netlogo/5.0/docs/whatis.html (Accessed: 3 January 2023).
Eom, M. and Kim, B.-I. (2020) ‘The traffic signal control problem for intersections: a review’, European Transport Research Review, 12(1), p. 50. Available at: https://doi.org/10.1186/s12544-020-00440-8.
Dopravní informace. Available at: https://dopravniinfo.cz (Accessed: 4 January 2023).
Code
The NetLogo file can be downloaded here:
https://www.simulace.info/index.php/File:Intersection_Simulation.nlogo
