Lightning Network Channel Dynamics Simulation (NetLogo)
Contents
- 1 Lightning Network Payment Channel Simulation
- 2 Results
Lightning Network Payment Channel Simulation
Introduction and Problem Definition
This simulation models the Lightning Network payment channels system. The simulation focuses on analyzing payment channel dynamics, network routing efficiency, and transaction success rates in a distributed payment network. The goal is to understand how different network parameters and routing algorithms affect the overall performance and reliability of the payment channel network.
Model and Method
The simulation uses an agent-based model approach where three types of agents (customers, merchants, and routers) interact through payment channels. The network is built using a graph structure where nodes represent agents and edges represent payment channels with specific capacities and balances.
Environment
The simulation environment consists of a 2D space where agents are randomly distributed. Each payment channel (edge) maintains:
- Total capacity
- Current balance in both directions
- Base fee
- Fee rate
- Connection status
Agents
Customers (70% of nodes)
- Shape: "person"
- Color: Blue
- Behavior: Initiate transactions to merchants
- Properties:
- Balance
- Pending transactions list
Merchants (20% of nodes)
- Shape: "house"
- Color: Red
- Behavior: Receive payments from customers
- Properties:
- Balance
- Pending transactions list
Routers (10% of nodes)
- Shape: "circle"
- Color: Yellow
- Behavior: Facilitate payment routing
- Properties:
- Balance
- Pending transactions list
Variables
Network Configuration
- num-nodes: Total number of nodes in the network (10-500)
- avg-connections: Average number of connections per node (2-10)
- max-connections: Maximum allowed connections per node (4-10)
- mean-channel-capacity: Average capacity of payment channels (1000-100000)
- min-channel-capacity: Minimum capacity of payment channels (100-10000)
Transaction Parameters
- transaction-rate: Rate of transaction generation (0-10)
- mean-tx-amount: Average transaction amount (10-10000)
System Variables
- auto-rebalance?: Toggle automatic channel rebalancing
- pathfinding-algorithm: Choice between "dijkstra" and "a-star"
Simulation Steps
Setup Phase
- Clear previous simulation state
- Initialize global statistics
- Create nodes (customers, merchants, routers)
- Establish payment channels
- Set initial channel capacities and balances
Go Phase (Repeated Each Tick)
- Generate new transactions
- Customers randomly initiate payments to merchants
- Transaction amounts follow a lognormal distribution
- Process pending transactions
- Select path using chosen routing algorithm
- Attempt payment along selected path
- Update channel balances if successful
- Channel rebalancing (if enabled)
- Identify unbalanced channels
- Adjust balances toward optimal distribution
- Update statistics and visualizations
Pathfinding Algorithms
Dijkstra's Algorithm
- Traditional shortest path algorithm
- Considers hop count as distance metric
- Implemented with standard distance tracking and path reconstruction
A* Algorithm
- Enhanced pathfinding with heuristic function
- Uses geographical distance as heuristic
- Maintains f-score, g-score, and h-score for optimization
User Interface
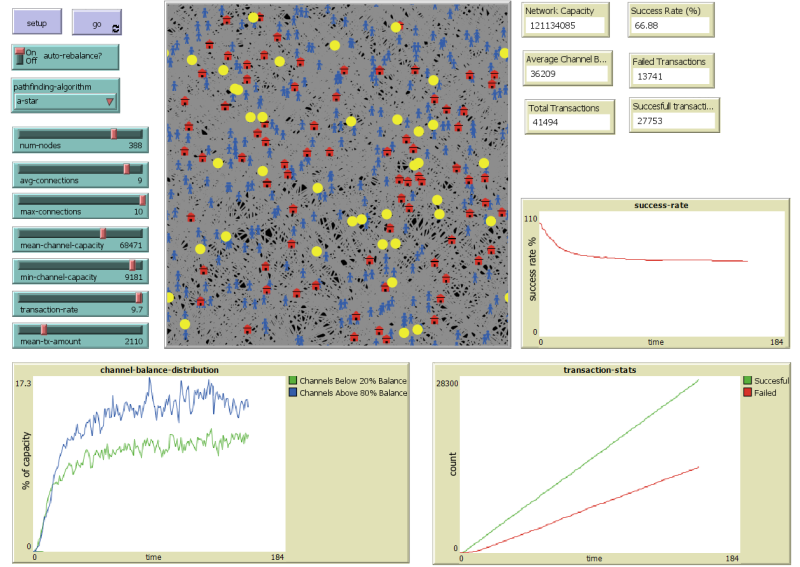
The simulation interface provides interactive controls and real-time visualization of the network:

Results Analysis
The simulation tracks and visualizes several key metrics:
Network Statistics
- Total network capacity
- Average channel balance
- Number of transactions (total, successful, failed)
- Success rate percentage
Visualizations
- Transaction Statistics Plot
- Tracks successful vs failed transactions over time
- Channel Balance Distribution Plot
- Shows percentage of channels with extreme balances
- Monitors channels below 20% and above 80% capacity
- Success Rate Plot
- Displays transaction success rate over time
Results
Simulation Scenarios
1. A* with Auto-rebalance ON
- Success rate stable at 66.88%
- Stable channel balance distribution
- Maintains consistent network functionality
2. Dijkstra with Auto-rebalance ON
- Success rate stable at 88.6%
- Well-managed channel balances
- Most stable and efficient configuration
3. A* without Auto-rebalance
- Success rate at 13.95% after 75 000 transactions and declining
- Channels become heavily unbalanced
- Network performance deteriorates rapidly
4. Dijkstra without Auto-rebalance
- Success rate at 15.27% after 75 000 transactions and declining
- Increasing channel imbalance over time
- Declining network performance
Key Findings
Auto-rebalancing Impact
- Success rates stabilize at 66.88-88.6% with rebalancing
- Without rebalancing, rates drop to 13.95-15.27% after 75 000 transactions
- Rebalancing prevents continuous performance decline
- Channel distribution stability requires rebalancing
Pathfinding Algorithm Effects
- Dijkstra consistently outperforms A*
- Dijkstra + rebalancing achieves best results (88.6%)
- Both algorithms suffer significantly without rebalancing
- Algorithm efficiency matters more with rebalancing enabled
Channel Balance Patterns
- Rebalancing maintains healthy distribution
- Without rebalancing, channels tend toward extreme states
- Balanced channels correlate with successful transactions
Parameter Impacts
- Higher mean capacity increases success probability
- Lower mean tx amounts relative to capacity increase success rates
- Higher average connections provides:
- More routing options
- Better network resilience
- Increased path finding success
- Trade-offs:
- Pathfinding complexity
- Rebalancing overhead
- Capital requirements
- Network maintenance costs
Simulation File
The complete NetLogo simulation can be downloaded here: File:Lightning network simulation.nlogo
Future Improvements
- Implementation of more sophisticated routing algorithms
- Addition of dynamic fee adjustment mechanisms
- Integration of more realistic network growth patterns
- Enhanced visualization of payment flows
- Implementation of channel opening/closing dynamics
Conclusion
This simulation successfully models the complex dynamics of a payment channel network, providing insights into:
- Network topology effects on payment success
- Impact of different routing strategies
- Channel capacity and balance management
- System scalability and performance characteristics
The model serves as a valuable tool for understanding the behavior and limitations of payment channel networks under various conditions and configurations.
Sources
- Poon, J., & Dryja, T. (2016). The Bitcoin Lightning Network: Scalable Off-Chain Instant Payments.
- Sivaraman, V., et al. (2020). Routing cryptocurrency with the spider network. USENIX NSDI.
- Martinazzi, S., & Flori, A. (2020). The evolving topology of the Lightning Network. PLOS One.
- Béres, F., et al. (2019). A cryptoeconomic traffic analysis of Bitcoin's Lightning Network.
- Pickhardt, R., & Nowostawski, M. (2019). Imbalance measure and proactive channel rebalancing algorithm for the Lightning Network.
- Wilensky, U., & Rand, W. (2015). An introduction to agent-based modeling with NetLogo. MIT Press.


