Impact of late lockdown and hospital capacity on 19-COVID spread
Contents
- 1 Problem definition
- 2 Method
- 3 Model
- 3.1 Variables
- 3.1.1 Initial population
- 3.1.2 Ratio susceptible people
- 3.1.3 Susceptible population
- 3.1.4 contact
- 3.1.5 Contagion Rate
- 3.1.6 New infections
- 3.1.7 Infected
- 3.1.8 New recoveries from infected
- 3.1.9 New symptoms
- 3.1.10 Ratio Symptoms
- 3.1.11 Symptomatic
- 3.1.12 New recoveries from symptoms
- 3.1.13 New Diagnostic
- 3.1.14 Ratio Diagnost
- 3.1.15 Diagnosed
- 3.1.16 New Recovery from Diagnostic
- 3.1.17 New Hospitalization
- 3.1.18 Ratio Hospitalize
- 3.1.19 Hospitalized
- 3.1.20 New Recovery
- 3.1.21 New Death
- 3.1.22 hospital bed
- 3.1.23 hospital utilization
- 3.1.24 lookup mortality
- 3.1.25 Taux Mortality
- 3.1.26 Dead
- 3.1.27 Recovered
- 3.1.28 official active cases
- 3.1.29 Ratio official cases/pop
- 3.1.30 New Diagnosed.1
- 3.1.31 Total Diagnosed
- 3.1.32 TTA recoveries
- 3.1.33 TTA Symptoms
- 3.1.34 TTA sympt
- 3.1.35 TTA Diagnostic
- 3.1.36 TTA diag
- 3.1.37 TTA Hospitalization
- 3.1.38 TTA Hospital
- 3.1 Variables
- 4 Results
- 5 Conclusion
- 6 Code
- 7 References
Problem definition
The coronavirus pandemic is an ongoing pandemic, the first case confirmed in Switzerland was on February 25th, 2020 and has known an exponential growth since. We know that the virus is spread from an infected person to a healthy one during close contact or via touching a contaminated surface. The aim of the simulation is to display the dynamics of the reaction time of the government to take measures and to see if the hospital capacity play a key role in the spread of the COVID-19
Method
Vensim modelling approach was selected due to dynamic behavior of the simulated system.
the model shows the evolution of the number of people who got infected by the covid-19 virus in countries where the population have a high health care protection and where the government have decided to make a decision about the virus propagation. The model will explain how fast the virus spreads itself and how political decisions can change the number of infected people at a given point in time. The construction of the model is simple: at the beginning one person is infected and will, then, infect other people. When you are infected many possibilities are open:
- You can be a healthy virus carrier. In that case you will not know that you have the virus and after 19 days you will be recovered.
- After 5 days you get symptoms, but you do not have any important health problems, you will recover in the next 14 days.
- After 5 days, you get symptoms and you are very sick and have respiratory problems, after 3 more days, still feeling bad, you decide to go to the doctor to get a diagnosis. The doctor has than two options: to send you back home, where you will recover after 11 more days or hospitalized you the next day.
- The doctor had decided to hospitalize you, you then spend two weeks in intensive care, where you will need artificial ventilation and 24-hour nursing care. You can then recover or unfortunately die.
The higher the hospital utilization, the greater the probability to die. Indeed, if hospitals get busier, the medical staff will be less available and health care quality might decrease. When the number of diagnosed and hospitalized people (which are the official number of cases) is greater than a certain percentage of the population, the government will take decisions to slow down the spread of the virus. This is to say that governments will take some measures, such as installing a forced lockdown of the population to decrease the number of contacts per habitant. Moreover, such a decision will have an impact on the population, which will be more aware of the situation and will be more careful to not spread or contract the virus. So, the contagion rate as the number of contacts per people will slow down. They will be less hospitalized people, that means less people in the hospital, meaning a better service and so less people who die.
Model
Following vensim model was developed based on the study.
Variables
Initial population
The Population of Switzerland can be found here: https://en.wikipedia.org/wiki/Demographics_of_Switzerland
=8 500 000
Ratio susceptible people
Decrease the susceptible people by the number of deaths due to the COVID-19.
=Susceptible population / (Initial population-Dead)
Susceptible population
Decrease the susceptible population by the number of new infections.
=-New infections
contact
Lockdown: Function IF THEN ELSE that bring the number of new people you meet (contact) from 5 to 0.05 if the ratio exceed 0.015%
=IF THEN ELSE("Ratio official cases/pop"> 0.00015, 0.05 , 5 )
Contagion Rate
Lockdown: contagion rate: IF THEN ELSE that bring the contagion rate from 0.1 to 0.075 if the ratio exceed 0.015%. Function of the awareness in the population (washing more often their hands if lockdown)
=IF THEN ELSE("Ratio official cases/pop" > 0.00015 , 0.075 , 0.1 )
New infections
It represent the new number of people infected each day.
=contact*Infected*Ratio susceptible people*Contagion Rate
Infected
It represent the stock of the new people infected. We start the model with 1 infected people.
=New infections-New recoveries from infected-New symptoms ///// Initial value: 1
New recoveries from infected
It represent the number of people without symptoms and they go in the recovered stock after 19 days.
=((1-Ratio Symptoms)*Infected)/TTA recoveries
New symptoms
It represent the number of new people that develop symptoms during 5 days before going to the symptomatic stock.
=(Infected*Ratio Symptoms)/TTA Symptoms
Ratio Symptoms
The ratio of people who develop some symptoms.
=0.2
Symptomatic
The stock of people symptomatic.
=New symptoms-New Diagnostic-New recoveries from symptoms
New recoveries from symptoms
It represent the number of people that have symptoms but that were not to the doctor, after 14 they are in the recovered stock.
=(1-Ratio Diagnost)*Symptomatic/TTA sympt
New Diagnostic
It represent the number of new people that are diagnosed each day, they stay 3 days before having the diagnostic.
=Symptomatic*Ratio Diagnost/TTA Diagnostic
Ratio Diagnost
the ratio of people that are diagnosed by a doctor.
=0.4
Diagnosed
The stock of people that are diagnosed by a doctor.
=New Diagnostic-New Hospitalization-New Recovery from Diagnostic
New Recovery from Diagnostic
It represent the number of people that are diagnosed and not sent to the hospital. they stay 11 days before going in the Recovered stock.
=(1-Ratio Hospitalize)*Diagnosed/TTA diag
New Hospitalization
It represent the number of people that are diagnosed and sent to the hospital. they stay 1 day before being sent.
=(Diagnosed*Ratio Hospitalize)/TTA Hospitalization Ratio Hospitalize
Ratio Hospitalize
The ratio of people that are Hospitalized.
=0.3
Hospitalized
The stock of people that are hospitalized before being Recovered or Dead.
=New Hospitalization-New Death-New Recovery
New Recovery
The number of people that recover each day from the hospitalization. It depends on the Taux Mortality which is depend from the hospital utilization (capacity or number of beds...).
=((1-Taux Mortality)*Hospitalized)/TTA Hospitalization
New Death
The number of people that die each day from the hospitalization. It depends on the Taux Mortality which is depend from the hospital utilization (capacity or number of beds...).
=(Hospitalized* Taux Mortality)/TTA Hospitalization
hospital bed
The number of bed in Switzerland is 356 beds for 100k people with 8.5M people it gives that number: https://www.swissinfo.ch/eng/coronavirus-crisis-_has-switzerland-got-enough-hospital-beds--/45671704
=30260
hospital utilization
For the utilization of the hospital I assumed that there is already 8260 beds used for regular patient (outside the covid pandemic). The more utilization we have, the greater the probability to die. Indeed, if hospitals get busier, the medical staff will be less available and health care quality might decrease.
=(Hospitalized/(hospital bed - 8260))
lookup mortality
The lookup function is used to described the taux mortality.
[(0,0)-(1000,0.3)],(0,0.065),(0.6,0.065),(0.8,0.12),(1,0.25),(1.2,0.3),(10,0.3),(1000,0.3)
Taux Mortality
The mortality rate depends on the hospital utilization. For example based on the above function, if the capacity reach 100% the hospital is full and the chance to die is then 25%.
=lk mortality (hospital utilization)
Dead
The stock of Dead people killed by the pandemic.
=New Death
Recovered
The Total amount of people who recovered from the pandemic.
=New recoveries from infected+New recoveries from symptoms+New Recovery+New Recovery from Diagnostic
official active cases
It represent the number of people that were tested and it's this number that will be used by the government to follow the pandemic and take decision of lockdown.
=Diagnosed+Hosptitalized
Ratio official cases/pop
The ratio that will be used for lockdown.
=official active cases/ Initial population
New Diagnosed.1
It's is just the same as New Diagnostic, it is used in the model to have the Total Diagnosed.
=New Diagnostic
Total Diagnosed
Used in the model to have the official number of cases in the model.
=New Diagnosed.1
TTA recoveries
Time to recover after being infected and not having symptoms.
=19
TTA Symptoms
The time you take to develop symptoms.
=5
TTA sympt
The time you take for recovering after being symptomatic.
=14
TTA Diagnostic
Time to go to the doctor and have the result.
=3
TTA diag
The time you take for recovering after being diagnosed.
=11
TTA Hospitalization
Time to go to the Hospital.
=1
TTA Hospital
The time you stay at the hospital before recovering or dying.
=14
Results
As explained in the problem definition we will focused our results on 3 cases.
- The first one is the normal scenario, with classic lockdown and regular numbers of beds for Switzerland
- The second is the same scenario as for the 1st one but the lockdown is delayed by 1 day,
- The third scenario is the normal scenario with a number of hospital beds reduce by 10 000 beds.
Normal Scenario
The first scenario take place in Switzerland with 8 500 000 peoples and a hospital capacity of 356 beds for 100k people. The first case was detected the 25 february 2019 and 20 days after the Government of Switzerland have decided to take some serious measures that is in our case represented by a lockdown.
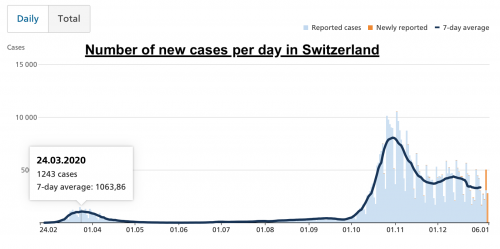
The following table show us the official number of new cases per day:
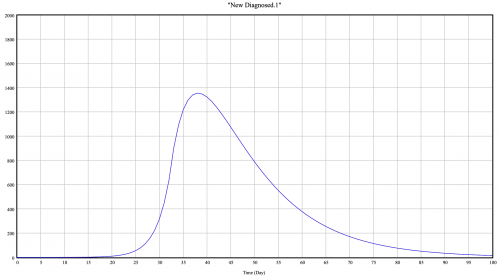
From the simulation we get:
We can see that the model is reality closed to the reality with a pic of 1350 after 35 days. The simulation stopped after 100 days so we just focused on these first 100 days. The reality display a pic at 1243 days after 30 days.
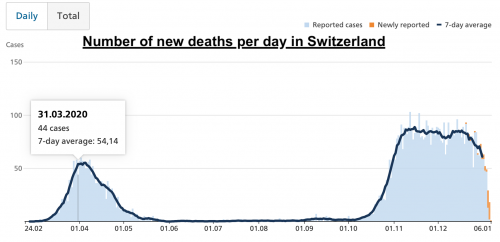
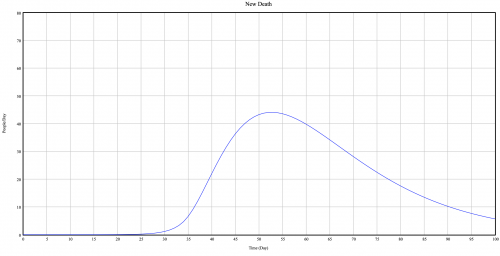
The true number of new death per day, and the number from the simulation is also display below:
We can see that the model is one more time really closed to the reality with a pic of 43 deaths after 50 days, while the reality display a pic at 44 days after 36 days.
We have seen that the simulation is really closed from the data obtained for the Switzerland, but now lets go trough some special cases to see the impact of some decisions on the variables.
Scenario 1: Late lockdown
In this scenario we will see what could have happened if the government take 1 more day to react and to set up the lockdown. To simulate such a scenario I simply increased the number of "Ratio official cases/pop" in the function IF THEN ELSE in "contact" and "contagion rate" from 0.00015 to 0.00018 and it delay the reaction of the government by 1 day.
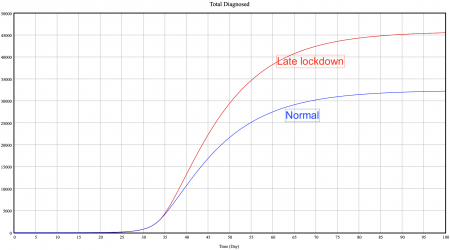
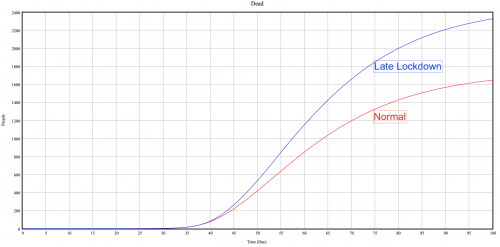
As you can see in the first graph, the total number of official cases (=total diagnosed) jump from 33 000 to 45 000 cases. An increase of 35% in the number of official cases by just delaying for 1 day the government decisions. It illustrates well the exponential effect on the model, indeed we don't have to forget that the delay is just one day but if it has been 4-5 days the number of cases would have been exponentially higher. The second graph shows the deaths jumping from 1600 to 2300, that is due to increasing number of cases and the hospital capacity reaching more than 60% utilization. Indeed due to the lookup function if the hospital capacity exceed 60% the mortality increase in the hospital. This is a very interesting scenarios that shows quite well the importance of the early lockdown and highlight the most important point in our model, the reaction time.
Scenario 2: Small Hospital capacity
In this scenario the number of hospital beds goes from 356/100k people to 238/100k people, a loss of -10 000 in variable hospital bed for Switzerland. This number of beds corresponds to the number of beds for a less developing country, such as Iceland (https://www.swissinfo.ch/eng/coronavirus-crisis-_has-switzerland-got-enough-hospital-beds--/45671704).
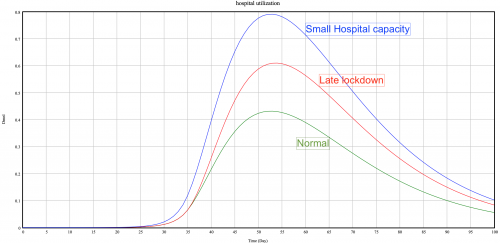
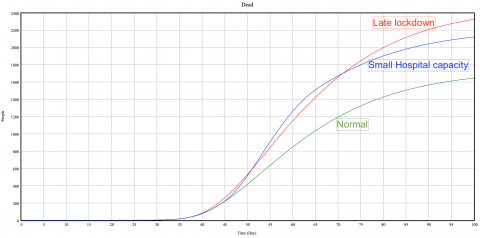
As you can see in the first graphs, the hospital utilization reach almost 80%. Patients are not treated as well as they would if the utilization was lower, and it involves more deaths for these patients (right graph). We can see the importance of hospital capacity and for government to have a good amount of hospitals.
Conclusion
To conclude I would say that it has been quite difficult to deal with the real data because I had to find every number or to adjust some variables to fit with the reality. Another difficulty that I had to faced was all times and units to setup.
The model display almost the same numbers as the ones communicated by the Swiss government, what could indicate that the model are not too far from what is happening in real-life.
The most important variable in the simulation is the reaction time of the government in order to take some measures against the fast spread of the virus, such as bringing more awareness or imposing a lockdown.
A further exogenous variable here is the number of hospital beds, which is a good proxy for modeling different countries. Having a smaller number of beds is a sign of vulnerability for the health care system and will impact mortality. A solution to this pandemic could therefore be to increase the number of beds in order to avoid exceeding capacity.
A limit to this simulation would be that it is a real pandemic, for example I first tried to simulate the full pandemic with the second pic (higher) as you can see in the graph of Switzerland but I have to admit that sometimes the reality (or my Vensim skills) are to difficult to simulate that is why I choose to stop the simulation after 100 days.
Code
References
- Federal Office of Public Health FOPH, https://www.bag.admin.ch/bag/en/home.html
- Fismann, D. (2009), “Modellig an Influenza Pandemic: A Guide for the Perplexed”, CMAJ,August.
- Madhav, N. (2017), “Pandemics: Risks, Impacts, and Mitigation”, November.
- Federal Office of Public Health FOPH, https://www.bag.admin.ch/bag/en/home.html
- https://www.swissinfo.ch/eng/coronavirus-crisis-_has-switzerland-got-enough-hospital-beds--/45671704
- https://www.covid19.admin.ch/en/epidemiologic/case?detTime=total&detRel=abs
- https://www.covid19.admin.ch/en/epidemiologic/death?detTime=total&detRel=abs

