Water flow through Vltava water cascade
Contents
Problem definition
Simulation by Tomáš Lízner
4IT496 Simulation of Systems (WS 2013/2014)
-- Xlizt00 23:57, 15 January 2014 (CET)
My task is to simulate water flow through six best known dams on Vltava water cascade. The dams are: Hnevkovice, Orlik, Kamyk, Slapy, Stechovice and Vrane. The principle of the simulation is quite easy - how fast can the individual dams release water without the river between the dams was on third flood stage.
Method
To deal with the problem I have chosen the method to create a simulation in tool for modelling systems dynamics called VentSim. I have used last known version of VentSim 6.2.
Model description
In model there are following entities:
General description
There is randomly generated initial flow and rainfall at the beginning of the simulation, both simulate much increased flow on water cascade, for example, in the spring after the snow and ice melts with bad weather conditions with raifalls. The initial flow is on start of the water cascade - this flow comes from other dams, from other rivers and from rainfall from the mountains. Every dam has two inflows and one outflow. First inflow comes from previous dam, which is located on the water cascade before, second inflow is from rainfall and other rivers, which comes into the flow between two dams.
Every dams has to respond to the increased flow into the dam and increase adequately outflow of the dam.
To better work with the numbers of flow, all flows are in units of thousands. The entire simulation runs in steps of one hour and simulates period for two weeks. This situation roughly corresponds to reality. Therefore, the flow units (which are commonly stated in m3 per second) are multiplied by number 3,600. Thus we get the flow rate per hour.
Dams
Every dam has several attributes (flow rates, flood levels, and capacities are based on real data [1] [2] [3] [4] [5] ) :
- minimum flow - This flow is used when the dams camapicty state is under required minimum of capacity or all inflows are less or equal this number
- maximum flow - This flow is used when the dams camapicty state is over required filling capacity and ther is threat that the dam could be ruptured
- optimal flow - This flow is used when the dam has normal state of capacity and there is no need to use maximal outflow
- minimal capacity - This number specify required minimum capacity of the dam
- maximal capacity - This number specify maximum capacity of the dam
- state of 3rd flood level - This number specify flood level of specific water flow between the two dams
- first filling coefficient - This coefficient is used for determining percentage rate of capacity when is needed to start outflowing a little more than the optimum flow
- second filling coefficient - This coefficient is used for determining a second level percentage rate of capacity when is needed to start outflowing even more than the first filling level
- third filling coefficient - This coefficient is used for determining a third level percentage rate of capacity when is needed to start outflowing when the risk of rapid implementation of the dam to its maximum capacity is higher then last two levels
- first increased flow coefficient - This coefficient is used for determinig percentage rate from maximum flow rate for using with first filling coefficient level
- second increased flow coefficient - This coefficient is used for determinig percentage rate from maximum flow rate for using with second filling coefficient level
- third increased flow coefficient - This coefficient is used for determinig percentage rate from maximum flow rate for using with third filling coefficient level
- inflows - as was mentioned above: First inflow comes from previous dam (or start of cascade), which is located on the water cascade before, second inflow is from rainfall and other rivers, which comes into the flow between two dams
- outflow - Outflow from the concrete dam, which is then used as an input (inflow) to the further dam
Equations
The model used a total of 4 types of equations:
1. Start of cascade - There has been used function RANDOM NORMAL( {min} , {max} , {mean} , {stdev} , {seed} ) min and max valuas are based on real data [4] , stdev has been determined to value 25 - because in fact there are not big differences in inflow from hour to hour.
2. Other inflows - There has been used same function as in 1., but with lower values (but depending on where in a specific flow of the dam enters another river yet)
3. Dam This equation is very simple: inflow from other dam + other inflows - outflow
4. outflow This equation is more complicated, but it can be very easilily understandable. I have chosen to assemble several consecutive nested IF THEN ELSE( {cond} , {ontrue} , {onfalse} ) statements with used logical statements as :OR: and :AND: Conditions are:
- First condition is used to ensure using only minimal outflow when the sum of inflows is less than or equal to the minimum outflow
- Second condition is used to ensure that there is no omission of the dam below the minimum capacity
- Third condition is used for determining using optimum outflow when the dam is filled less to first filling coefficient
- Fourth condition is used for situation, when the dam is filled more then percentage of first filling coefficient but less then percentage of second filling coefficient - If yes, calculation of increased flow is used with first increased flow coefficient
- Fifth condition is used for situation, when the dam is filled more then percentage of second filling coefficient but less then percentage of third filling coefficient - If yes, calculation of increased flow is used with second increased flow coefficient
- Sixth condition is used for situation, when the dam is filled more then percentage of third filling coefficient but less then percentage of 90% of maximum capacity of dam - If yes, calculation of increased flow is used with third increased flow coefficient. for the case when the of the dam becomes full on over 90%, outflow equal to flood level is used. This ensures that in the flow of water was not more than specified flood level.
Changes in the model
After starting the simulation, user can easilly change sliders to make different effect to the rate of outflow for individual dams. Changes in the running simulation are immediately appeared on the graphs for all atributes/dams/flows.
Results
If the model has setted same values in filling coefficients and increased flow coefficients for all dams, the results are:
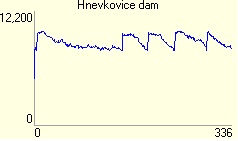
1. Hnevkovice dam - Reservoir initially relatively quickly filled on 85% of capacity, then there takes a while to decrease on 75% of capacity, and then begins to oscillate between these values in a shorter time.
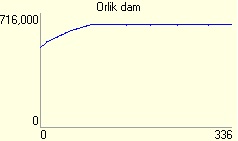
2. Orlik dam - Because Orlik dam has huge capacity and is able to retain a lot of water for a long time, there is no suprise, that the Orlik dam is slowly filled on 90% of capacity and then is held on this capacity at the end of the simulations run.
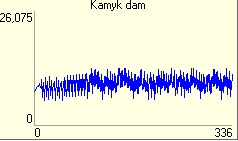
3. Kamyk dam - Kamyk outflow is more unbalanced. It ranges from 70 to 90% of capacity. It is caused by a large outflow from a previous dam Orlik on which this dam can not respond smoothly.
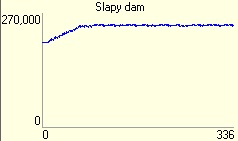
4. Slapy dam - The dam Slapy has a similar situation as on dam Orlik. This dam has also huge capacity, so dam is slowly filled on 90% of capacity and then is held on this capacity at the end of the simulations run.
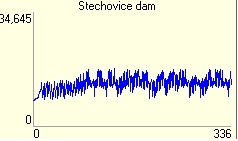
5. Stechovice dam - Stechovice outflow is more again little unbalanced and its flow ranges from 70 to 90% of capacity.
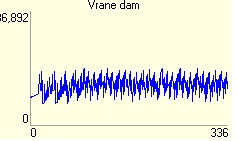
6. Vrane dam - Same situation here as dam above.
Conclusion
The more impact on the state of the dams has the set of third increased flow coefficient to maximal value and third filling coefficient to lower value. That meens, the dum starts with huge outflow very soon. Buty this causes large fluctuations in levels of dams. On the contrary, changing the minimum and optimum flow rates are almost negligible because they are in the simulation due to large inflows used only at the beginning therefore does not affect much the result.
Increasing the maximum capacity, while keeping the same coefficients extends the maximum value of capacity and this leads at first only for filling of the dam. Increasing the other flows into the dam will very accelerate its filling.
This model is a simplified behavior of reality. In fact, the filling and draining of the dam is more smoothly, without oscilating. This behavior in the model is due to the relatively small number of used coefficients for each dam and a limited possibility for calculations. Another thing that is not included in the model are situations when it is necessary to produce electricity, although could be dam much sooner drained before approaching large wave of water.
As an possibility for improvement this model would be using for example some rainfall patterns in programmable multiagent environment.
Code
Casual loop diagram Media:Water_cascade.zip
Stock and flow diagram Media:Water cascade-flow6.zip
Resources
[1] ČESKÝ HYDROMETEOROLOGICKÝ ÚSTAV. Konfigurace modelu Vltavské kaskády v prostředí AquaLog [online]. 2002 [cit. 2014-01-15]. Available at: http://voda.chmi.cz/pov02/3etapa/vlt_kaskada/kap1.pdf
[2] POVODÍ VLTAVY, státní podnik. Hladiny vody v nádržích [online]. 2014 [cit. 2014-01-15]. Available at: http://www.pvl.cz/portal/nadrze/cz/index.htm
[3]POVODÍ VLTAVY, státní podnik. Zabezpečenost minimálních průtoků v tocích pod nádržemi [online]. 2013 [cit. 2014-01-15]. Available at: http://www.pvl.cz/portal/hydroprojekt/VH/B/2_TABULKOVA_CAST/VH_B20.pdf
[4] POVODÍ VLTAVY, státní podnik. Souhrnná zpráva o povodni v srpnu 2002 [online]. 2003 [cit. 2014-01-15]. Available at: http://www.dibavod.cz/data/povodnove_zpravy/vltava/vltava_08_2002.pdf?PHPSESSID=b32f83c256d387bb29c
[5] Vltavská kaskáda [online], last actualization 23. 9. 2013 v 12:15. [cit. 2014-01-15], Wikipedie. Available at: http://cs.wikipedia.org/wiki/Vltavsk%C3%A1_kask%C3%A1da
