Ultimatum Game
Aim of this project is to analyze the socio-economical game known as the Ultimatum game. We study different strategies for the game in order to determine how successful those strategies are in various scenarios. We also study how the strategies of the players will develop through time if we use an evolutionary algorithm to adjust them.
We study the game using a multi-agent system where the agents play the Ultimatum game against each other using different strategies.
Contents
Rules of the game
The game is played by two players, the first one is called the proposer and the second one the responder. The proposer is given some amount of money, lets say $1000 and his task is to divide the money between the two players. To do that, the proposer decides how much money the other player will get and announces the offer to the second player. Then the second player has two choices: he can either accept the proposal or reject it. In case he accepts, both players receive the amount of money according to the proposal, otherwise no player receive any money.
A few additional information about the game should be pointed out
- the players are anonymous - they don't know each other, never communicated before and never will after the game
- the players can't communicate during the game except of the proposal. There is only one proposal (no second chance in case of rejection)
- the responder knows the total amount of money. E.g. if the proposal is $10, he knows weather it is 10 out of 20 or 10 out of 1000.
- goal of all players is to maximize their own profit
Method
We use a multiagent system to simulate a long-term development of the system where players of the game. In the simulation, we use agents to represent players using different strategies that play the game repeatedly against each other. For each agent, we store the information of the strategy he uses, total amount of money he has earned and how many games did he play. The amount of money that agents play for in each round is always the same.
One step of the simulation looks like this:
- An agent is selected randomly to be the proposer
- . Another agent is selected randomly to be the responder
- The proposer proposes money according to his parameter P
- The responder accepts if the propose is greater of equal than his parameter A, otherwise he rejects
- If the proposal was accepted, agents receive appropriate mouth of money
During the simulation, many such steps is executed subsequently until it is clear which strategies are the most profitable.
For the purpose of the simulation, we represent the strategy of the player as a pair of real numbers P, A from <0,1>. Number P represents how much the player will propose - i.e. P = 0.3 means that the player will propose 30% of the total amount to the second player. The number A will then represent how much the player is willing to accept - e.g. A = 0.2 means that the player will accept 20% of the total amount or more and he will reject proposals that are smaller than 20%. Such concise representation is possible thanks to the anonymity of the game - the player doesn't know who his counterpart is and he can't base his decisions on that.
We took, however, two simplifications that deserve elaboration.
1. We don't allow randomized strategies The players might use random variables instead of fixed values for P and A. In each round, he would draw a random number according to the probability distribution and use it as P or A. This simplification should not matter because in the long run the profit of the player using random variables should converge to the profit of the player using fixed values - means of those random variables.
2. Players could base their decision on his current score For example a very poor player might decide to accept a proposal even of he considers it unfair and would normally reject it. We believe that this simplification doesn't affect the results because we don't care about the absolute profit of the players but rather about comparison of scores of different players. To affect such comparison, the player would have to take into account also the score of his counterpart in the game, which is impossible due to anonymity.
Software tool
We have developed a tool for executing the simulation and visualizing the results. The tool doesn't depict results of individual agents but rather the results of strategies. Lets define the space of strategies as follows: a strategy (P,A) corresponds to a single point in 2 dimensional space of <0,1> x <0,1>. This 2D interval we call the space of strategies. Each agent can be situated in this space according to the strategy he is using. For the purpose of visualization the profitability of strategies, we use discretization of the strategy space into groups and visualize average results of each group. The agents in the environment are divided into groups according to the strategy they use. Agents inside the same group use similar strategy and profitability of each group is calculated as average profit of agents in the group. These results are then visualized for each group as well as the number of agents in each group. This way we can see how profitable different strategies are and how many agents are using them.
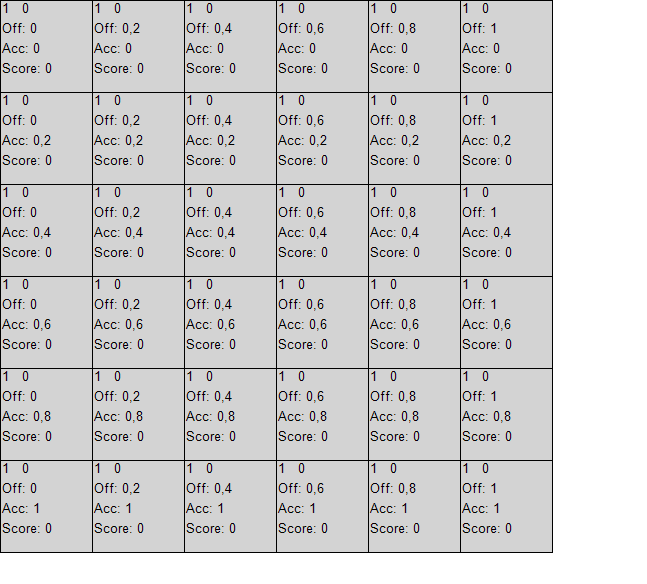
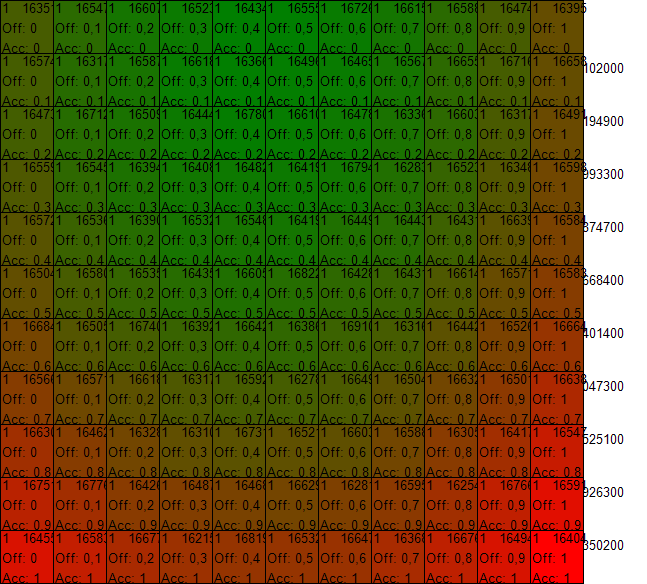
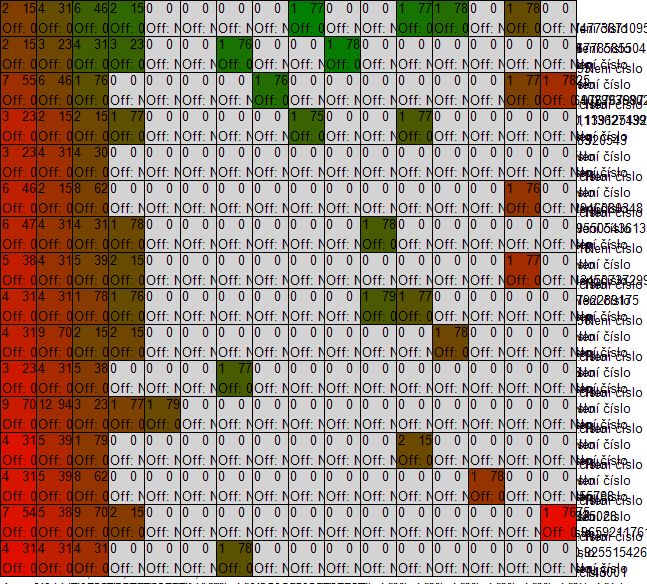
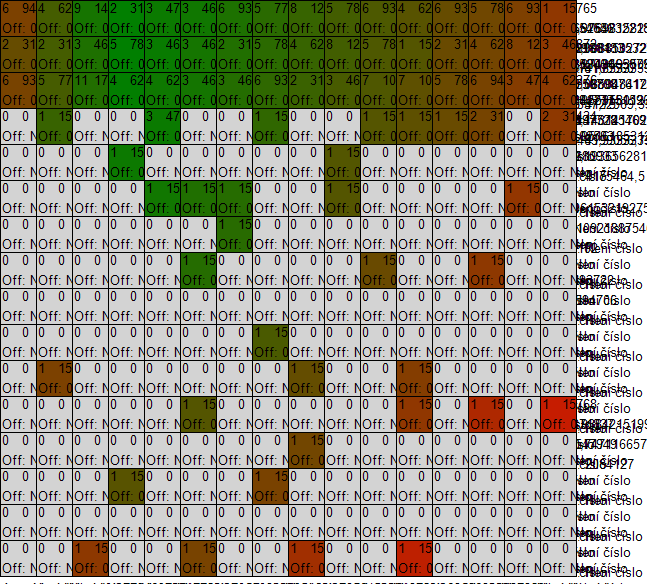
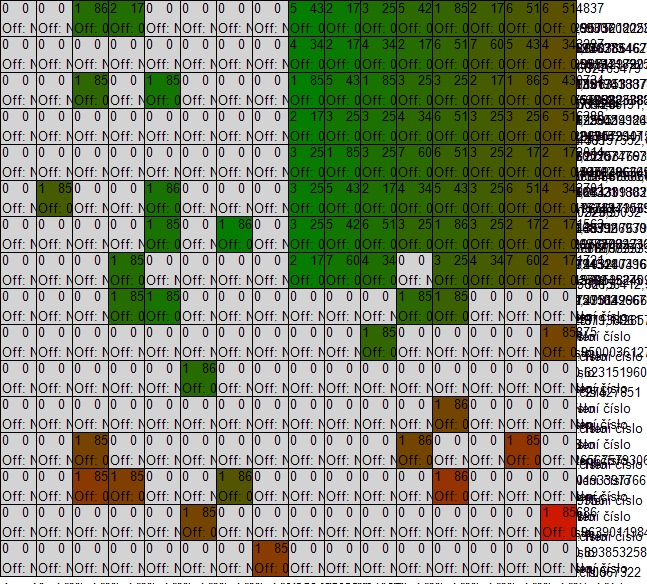
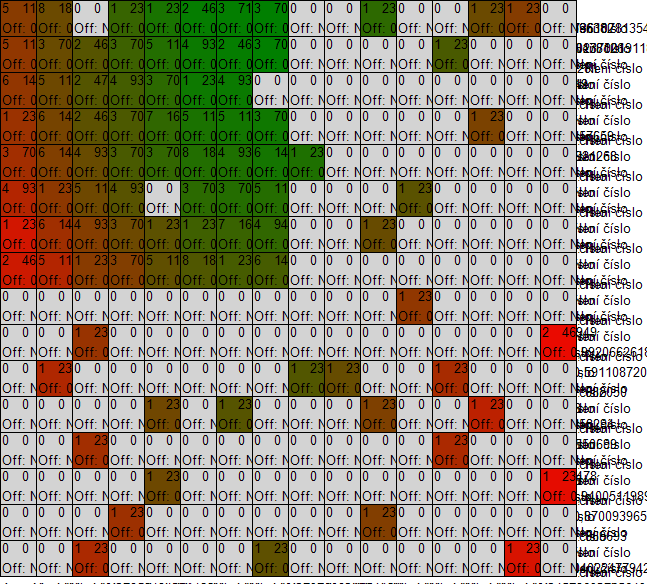
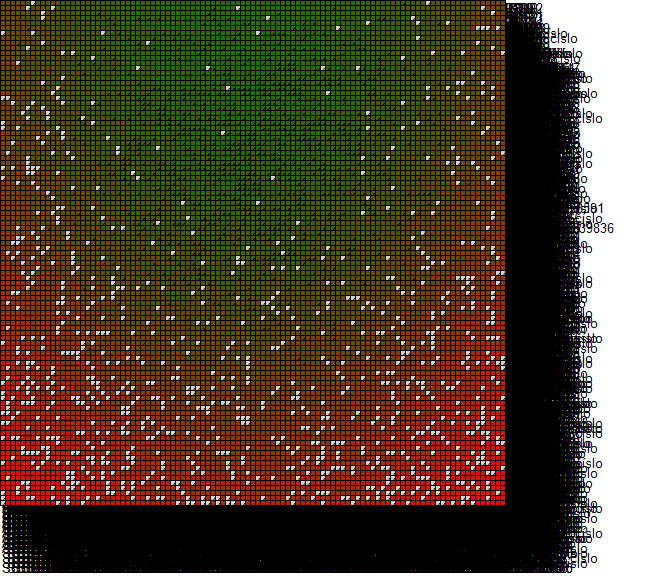
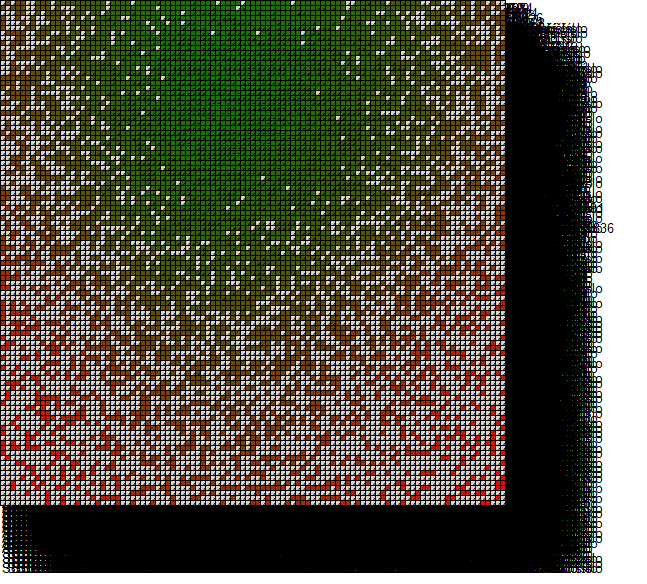
The tool uses a parameter called granularity to determine the number of groups. For example granularity = 10 means that there will be 10 categories for values of parameter P and 10 categories for values of A. Those categories are intervals <0, 0.1), <0.1, 0.2), <0.2, 0.3) and so on. An agents with P = 0.33 a A = 0.125 will be assigned into category P Failed to parse (MathML with SVG or PNG fallback (recommended for modern browsers and accessibility tools): Invalid response ("Math extension cannot connect to Restbase.") from server "https://en.wikipedia.org/api/rest_v1/":): {\displaystyle \in} <0.3, 0.4) and A Failed to parse (MathML with SVG or PNG fallback (recommended for modern browsers and accessibility tools): Invalid response ("Math extension cannot connect to Restbase.") from server "https://en.wikipedia.org/api/rest_v1/":): {\displaystyle \in} <0.1, 0.2). These categories are then depicted in a form of a square grid as shown in the picture.
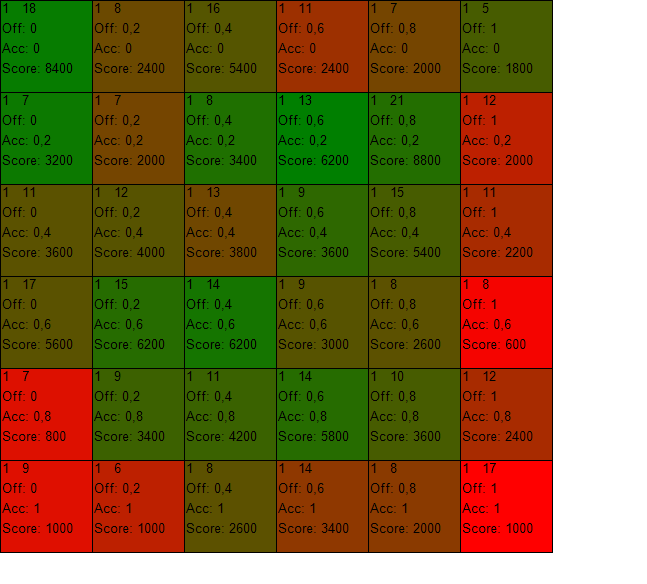
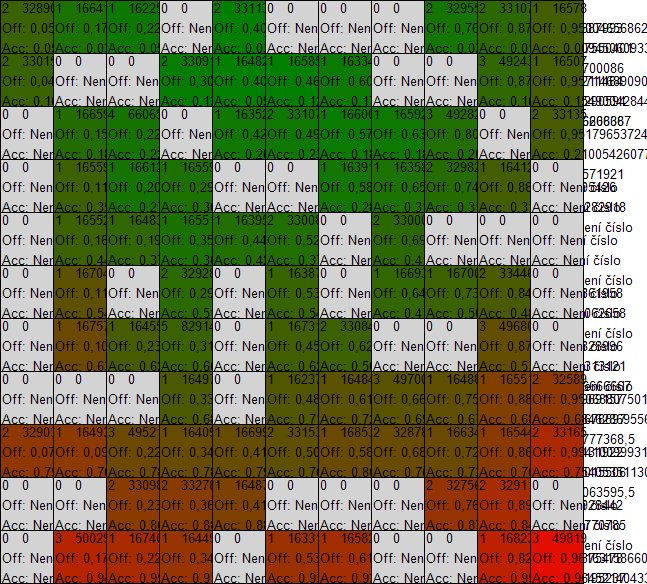
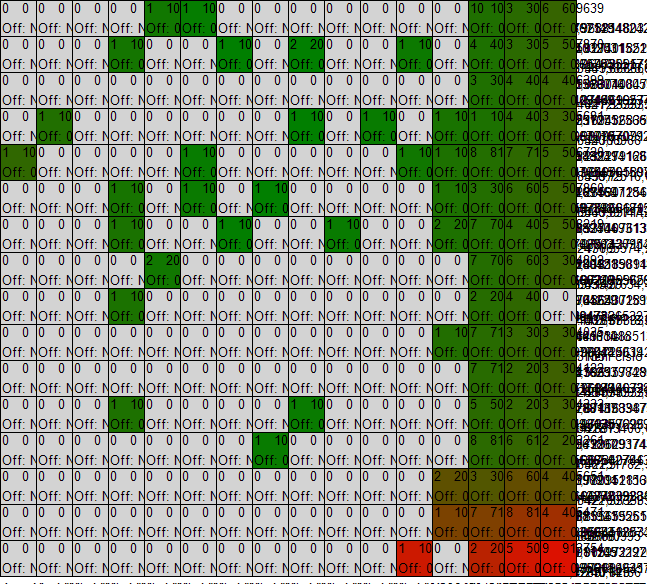
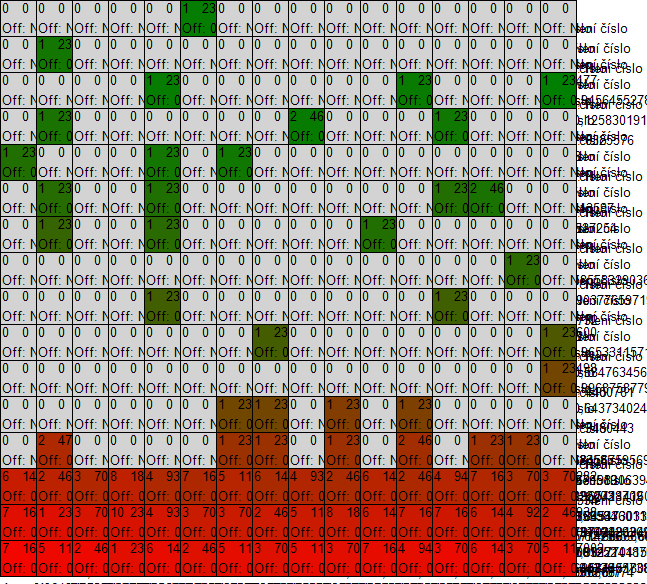
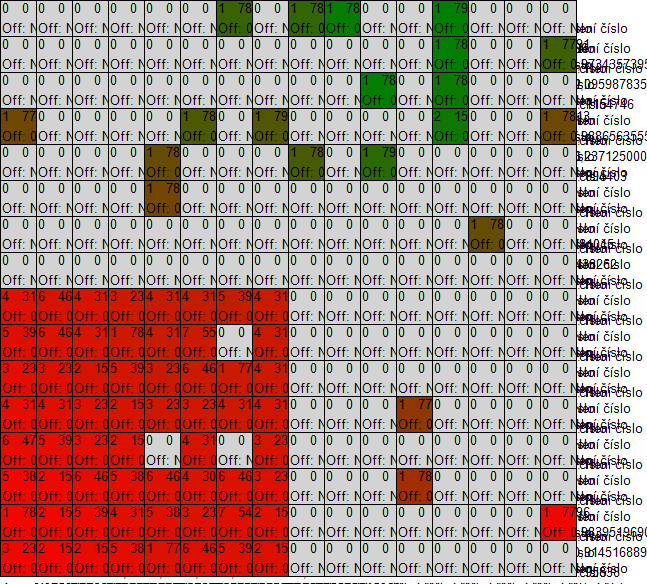
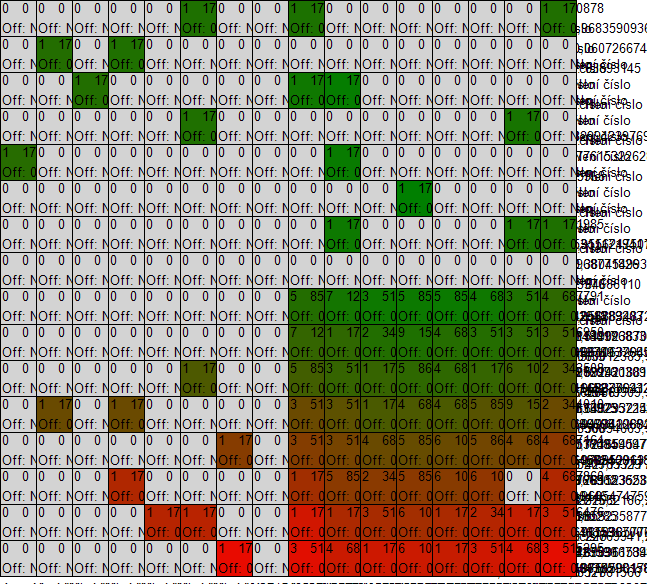
On the horizontal axis there are values of P increasing from left to right and on the vertical axis there are values of A increasing from top to bottom. Granularity is in this case 5, which means that the size of one "window" is 1/5 = 0.2. The average score of agents in the group is visualized using color coding - red color represents low score and green color corresponds high score. The values between low and high are represented as a mixture of colors red and green and empty tiles are colored gray. An example is shown in the following picture.
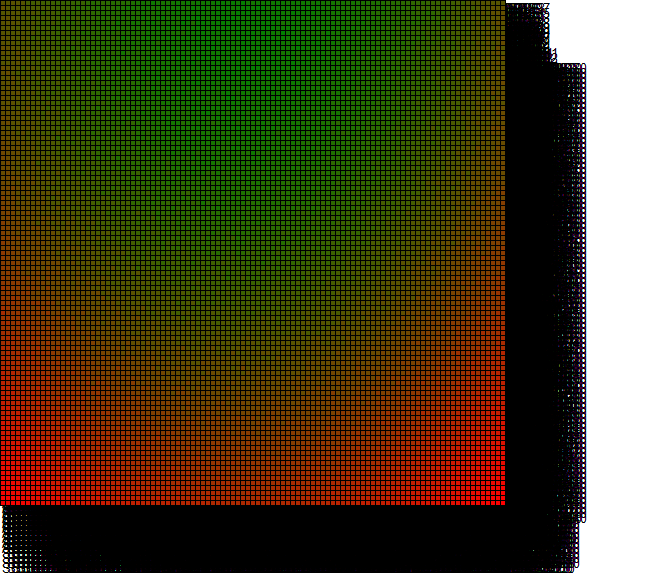
The tool is also capable of producing a 3D bar graph where the score in the groups is represented by the height of the bars. A 3D graph corresponding to the previous example can be seen here.
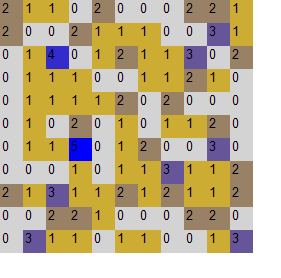
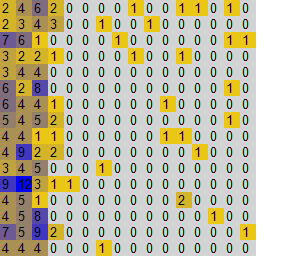
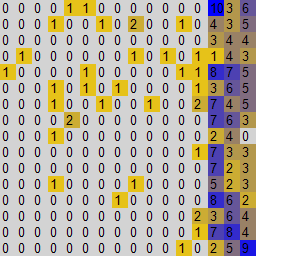
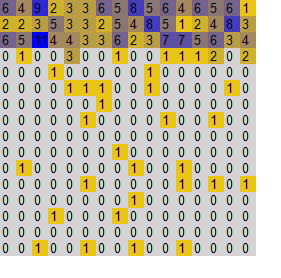
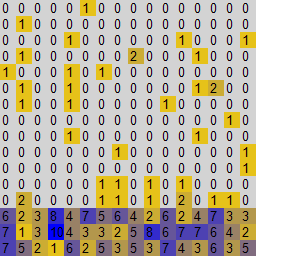
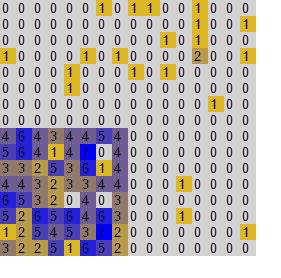
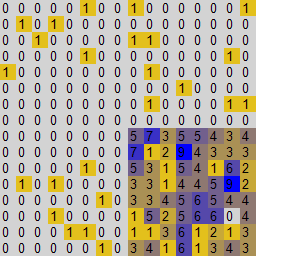
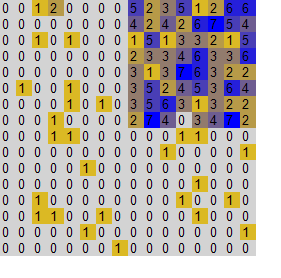
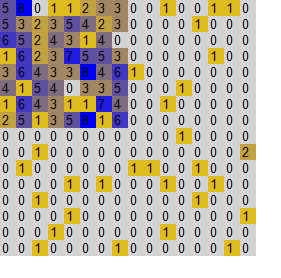
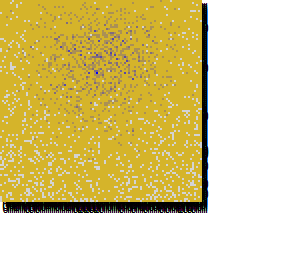
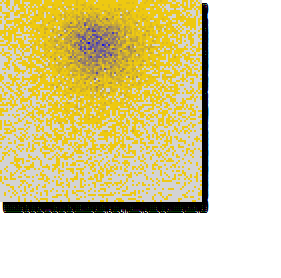
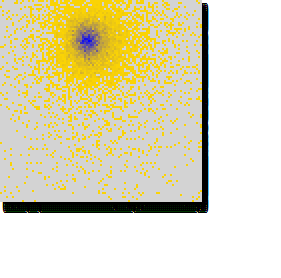
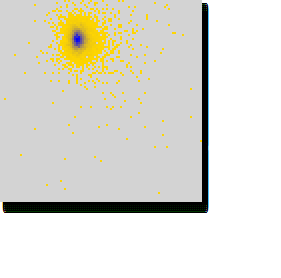
Another diagram the software tool produces represents the distribution of agents in the space of strategies. Grey color represents an empty tile, yellow color denotes low number of agents and blue color means the number of agents in the group is high. The diagram looks like this:
With low granularity, the number of categories is low and they can be concisely depicted, but the numbers are imprecise since we group together large ranges of values (e.g. in the previous example, agents with P = 2.1 and P = 3.9 cannot by distinguished. High granularity on the other hand provides precise numbers but the diagram is more complex. The number of agents in the simulation is set to granularity x granularity such that there is at least as much agents as groups.
Experiments
The profit of the player depends on the strategies that other players use. For example if most players use A > 0.4 then agent with P = 0.3 will hardly get any profit, but in other situation the value P = 0.3 might work well.
We have conducted several experiments with various initial conditions to determine which strategies are successful in those situations.
Uniform environment
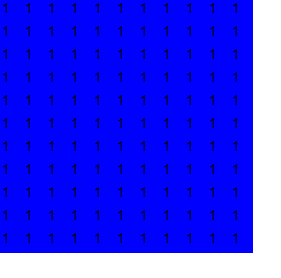
In this case each group contains exactly one agent, i.e. agents are uniformly distributed in the space of strategies.
Distribution of agents:
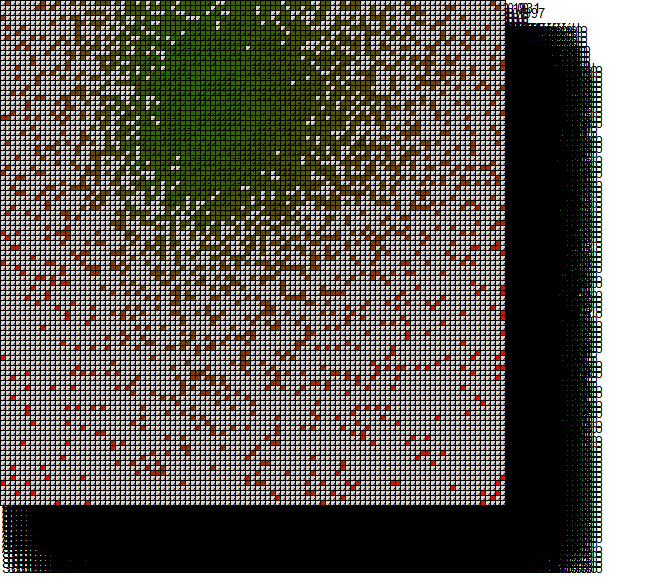
Profitability diagram after 1 million steps (with granularity 10):
With granularity of 100 and 10 million steps the results are similar
We can conclude, that when playing in an environment where all strategies are equally represented, the best strategy is to propose close to 40% and accept anything.
Random distribution
In this scenario, the strategy of each agent is selected uniformly randomly.
Distribution of agents:
Results after 10 million steps:
With large granularity and large number of steps, the results are very similar to the previous case.
Specific distributions
In this section, we present results of scenarios where agents were placed in specific parts of the strategy space with some random noise. 10% of the agents are placed randomly, while 90% of them are distributed in a predetermined area. We present results with granularity 15. Experiments with higher granularity and number of agents give very similar results.
Low proposes
Distribution of agents:
Results after 10 million steps:
High proposes
Distribution of agents:
Results after 10 million steps:
Low acceptance
Distribution of agents:
Results after 10 million steps:
High acceptance
Distribution of agents:
Results after 10 million steps:
Evil players
By "evil" we denote players that offer low values and accept only high values
Distribution of agents:
Results after 10 million steps:
Morale players
By "morale" we denote players that offer high values and accept only high values
Distribution of agents:
Results after 10 million steps:
Naive players
By "naive" we denote players that offer high values and accept low values (i.e. accept more or less anything)
Distribution of agents:
Results after 10 million steps:
Greedy players
By "greedy" we denote players that offer low values and accept low values
Distribution of agents:
Results after 10 million steps:
Evolution of strategies
In the previous experiments the players were using the same strategy the entire time. We would like to model situations where players can change their strategies if they don't perform well. To do that we use an evolutionary algorithm. One evolutionary step looks as follows:
- Select two successful agents called parents using tournament selection
- Create new agent called the offspring
- Set strategy of the offspring to be a combination of strategies used by parents: Failed to parse (MathML with SVG or PNG fallback (recommended for modern browsers and accessibility tools): Invalid response ("Math extension cannot connect to Restbase.") from server "https://en.wikipedia.org/api/rest_v1/":): {\displaystyle P_{offspring} = (P_{parent1} + P_{parent2}) / 2 } and same with A
- Mutate the strategy of the offspring by adding or subtracting small random number
- Select weak agent using tournament selection with reversed fitness function (the lower the score the higher probability of being selected)
- Replace the weak agent by the offspring
The tournament selection that we are using works as follows:
- Set the parameter k = size of the tournament
- Select k agents uniformly randomly
- Select the best agent among these k
After every one hundred of simulation steps we execute one evolutionary step.
Experiments with evolution
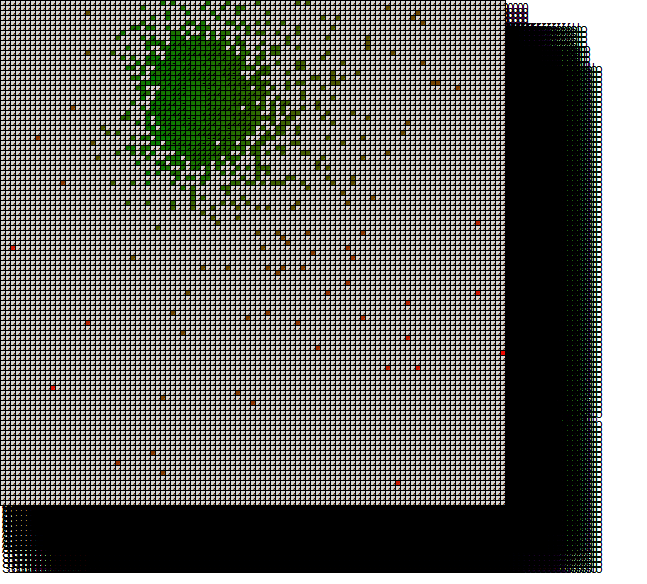
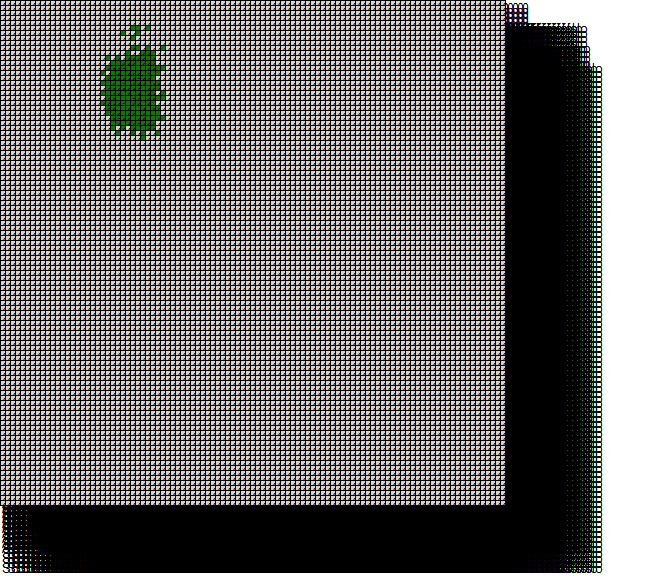
We only present the results of an experiment with uniform environment here. We conducted experiments with evolution in each of the previously mentioned environments, but the results were always very similar - the whole population moved close to the central point of the strategy space and from there it slowly converged towards the upper-left corner, to the strategy "Offer very little, accept anything".
Distribution and score after 1 million steps:
Distribution and score after 5 million steps:
Distribution and score after 10 million steps:
Distribution and score after 20 million steps:
Distribution and score after 100 million steps:
Conclusion and future work
Results of the experiments show many interesting phenomena:
- The successfulness of the strategy greatly depends on the environment
- Compare for example results in case of uniform environment and high offering environment
- If all opponents' strategies are equally probable, it is rational to propose about 45% and accept everything
- See the uniform environment experiment
- If most players offer high values, the acceptance parameter is no longer important and all players will have almost the same score
- See the high offers experiment
- If most players accepts only high offers, it is necessary to propose high (which should be obvious)
- See the high acceptance experiment
- Evil players are never very profitable, they can keep up only in high proposing environment and low acceptance environment
- Naive players are especially profitable in presence of large number of evil players
- See the evil environment experiment
- Greedy players are profitable in most environments
- For every strategy there is an environment where this strategy doesn't work
- Whenever most players use the same strategy, a single individual can take advantage on them by using different strategy
- This is the reason why our evolutionary process didn't lead to any interesting results and converges toward the upper-left corner
- When using our evolutionary process as a transition rule, the point (0,0) - upper left corner - is a strong attractor whenever all players are using similar strategy
The greedy strategy, which seems to be an attractor, is definitely not optimal in all environments - for example suppose that a group of 100 agents is using the greedy strategy of P = 0.2, A = 0.1. Then if we add another group of 100 agents to the system which would use a "moral" strategy of P = 0.4, A = 0.3, this second group would be more profitable in long run (without evolution). Proof: lets denote the "greedy" group as A and the "moral" group as B. Each single game can run according to these four scenarios:
- the proposer and the responder are from A: in this case the game results in "accept" and the money goes to group A
- the proposer and the responder are from B: similarly, the game will result in "accept" and the money goes to group B
- the proposer is from A and the responder is from B: the game will in this case result in "reject" and no group will gain any money
- the proposer is from B and the responder is from A: in this case, game results in "accept" and group A will get 40% of the money and group B gets 60%.
Since all these possibilities are equally probable, group B will be more profitable in the long run. The proof, however, strongly depends on the fact that both groups are of similar size. If for example the group B was much smaller in numbers, then the scenario (1) would be more probable and the overall results would work for A.
The problem of our evolutionary process is that once most agents use similar strategy, the evolution doesn't create a new large group of agents using completely different strategy, it only creates individuals which don't have enough power to overcome the majority.
For future work, we believe that by modifying the evolutionary process such that large groups of agents using foreign strategy could appear, we could answer the question of whether evolutionary stable strategies exist and what do they look like.
Code
The following archive contains all C# source codes of the software tool used to conduct the simulations as well as executable files and results of simulations presented in this report.
OtakarTrunda (talk) 21:00, 17 January 2016 (CET)
