Software Support Lifecycle
Contents
Problem Recap
A software firm was contracted to develop a new customer-facing solution for a major banking institution. As part of the negotiation process, an SLA needs to be reached. The banking institution provided required issue resolution times and asked the software firm to appropriately price the contract while provide reasoning for the contract pricing.
The software firm decided to create a simulation of a typical month of the support cycle as a basis for approximate the resources needed to provide the support.
Approach
The model consists of various severity incidents, represented as entities, and various development resources, represented as resources in SIMPROCESS. The model aims to represent a reasonably simplified version of the real development process.
The model needs to represent developer shifts, “emergency holding” (where developer does not work, but is available to start solving incidents in a reasonable amount of time) and overtime billing.
Model Structure
Entities
Incidents
There are several severity of incidents, represented as different types of entities. The severity of incident, apart from having different SLA requirements, differ in their flow throughout their process. Different severity incidents are generated using different rules. The SLA terms of different incidents can be found here.
| Incident Type | Severity (lower is less severe) | Probability of Occurrence (per hour) |
|---|---|---|
| Standard | 1 | Nor(0.4, 0.25, 1) |
| Severe | 2 | Nor(0.2, 0.25, 1) |
| Critical | 3 | Nor(0.075, 0.25, 1) |
It is important to note, that higher severity incidents can preempt lower severity incidents, which is desirable as higher severity incidents have more strict SLA terms.
While the normal distribution is sometimes considered problematic when using it to generate entities, due to the fact that a lot of real distributions are not symmetrical and instead are “right-leaning”, I believe that the normal distribution is sufficient for this scenario. An alternative shape that seem to be a bit more realistic was a beta distribution, but seeing the relatively small impact on the results, I chose a normal distribution, since it is far more accessible and requires less expertise to understand.
Technical Entities
Another type of entity in the system is a Release Trigger. The Release Trigger is responsible for triggering an automated software build every 24 hours.
Resources (Developers)
Developers are grouped into three tiers – standard, junior and senior. Each developer tier has different pricing (here) and might not be able to participate in all parts of the process. The developers get paid a fixed wage, regardless of their utilization. The developers work in the 8x5 mode. This is however problematic when dealing with high-severity incidents, which have strict SLA terms.
Therefore, a new tier has been added – “Developer – Standard – Overtime”. The role of this tier is to hold “emergency” in non-working hours of the day (17:00 – 9:00 on work days + whole weekends). Holding emergency means, that the developer is ready to immediately start resolving critical bugs from his home office. For this, the developer is compensated in the following way: The developer gets paid 10% of his standard hourly wage for every hour he holds emergency, regardless of the number of incidents (fixed cost). Apart from that, the developer gets paid for every hour he spends resolving incidents in the emergency hours (variable cost).
Support Process
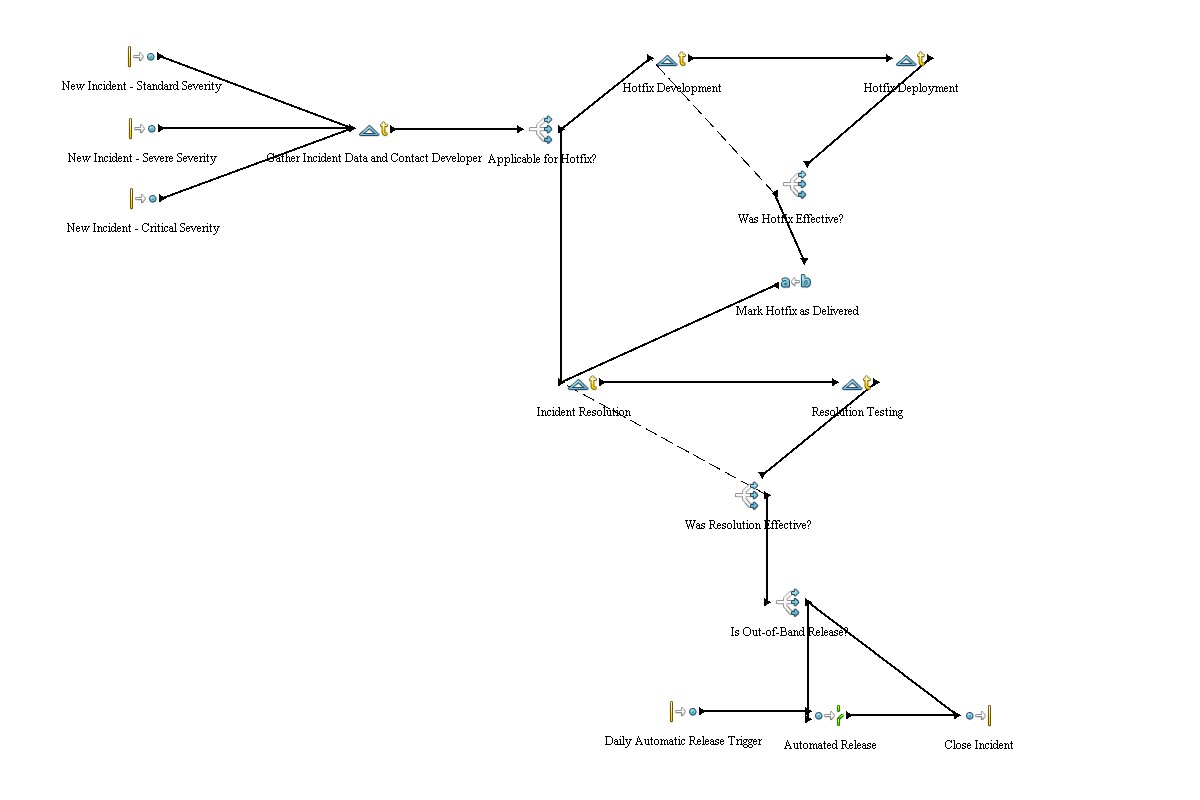
The incident resolution process is as follows:
Things to note about the process:
- Standard severity incidents are not eligible for hotfixing
- Since junior developers do not have full knowledge of the system, they are excluded from the hotfix development and incident resolution activities
- Hotfix development is a high-risk activity (deployed directly to production without proper testing), standard developers need to pair up when developing the hotfix
- Critical incidents are released “out-of-band”, meaning they do not wait for the next release and are released individually
Simulation Result & Analysis
The conflicting goals of the task are obvious. On the one side, we wish to minimize the time of incident resolution. Unless we consider rearchitecting the support process, this is done mainly by deploying additional resources. On the other side, we wish to minimize the amount of deployed resources to optimize support costs and create room for margin generation.
The model shows, that a good compromise between these two goals can be reached with the following resource deployment:
| Resource Type | Number of Resources |
|---|---|
| Junior Developer | 1 |
| Senior Developer | 2 |
| Standard Developer | 4 |
| Standard Developer - Overtime | 2 |
The rest of this chapter will aim at providing supporting evidence for this conclusion. I will refer to the above configuration as 1-2-4-2 configuration
Utilization and Depreciating Returns on Additional Resources
The utilization of the above configuration is as follows:
| Resource Type | Utilization (%) |
|---|---|
| Junior Developer | 49.93 |
| Senior Developer | 65.35 |
| Standard Developer | 79.1 |
| Standard Developer - Overtime | 83.09 |
Granted, the utilization above might seem low. Consider the case when we remove one Senior Developer from the team. Than the utilization will be as follows (1-1-4-2):
| Resource Type | Utilization (%) |
|---|---|
| Junior Developer | 87.77 |
| Senior Developer | 94.92 |
| Standard Developer | 95.7 |
| Standard Developer - Overtime | 96.45 |
This looks much better. It is however important to realize, that while near 100% utilization is good for product development teams, for support teams the situation looks different. There, utilization near 100% means very little headroom for situations where more than expected incident occur. To illustrate this, let’s compare average incident resolution times between 1-2-4-2 and 1-1-4-2
| Incident Type | Average Resolution Time (hours) | Maximum Resolution Time (hours) |
|---|---|---|
| Critical | 13.76 | 36.01 |
| Severe | 36.23 | 94 |
| Standard | 63.72 | 159 |
| Incident Type | Average Resolution Time (hours) | Maximum Resolution Time (hours) |
|---|---|---|
| Critical | 11.11 | 21.36 |
| Severe | 28.51 | 81 |
| Standard | 36.64 | 122 |
As we can see, the difference in resolution times is stark, especially when considering the average resolution time of standard-severity incident, which almost doubled. As we can see, utilization nearing 100% percent can actually considered bad, as it lowers the ability of support teams to appropriately absorb additional incidents.
From the other side, when we add additional resources to the 1-2-4-2 scenario, we see only small decreases in resolution times. Therefore, the 1-2-4-2 seems to be a good compromise from the utilization/resolution time standpoint.
Minimizing Resolution & Hotfix Delivery Time Spikes
An important characteristic that deserves extra attention are individual resolution and hotfix times. So far, we have been mostly concerned with averages, but when running an SLA-bound support team, it is important to consider the fix times for individual incident, with utmost focus on minimizing the number of “spikes” in critical incidents, as those have severe impact on customers.
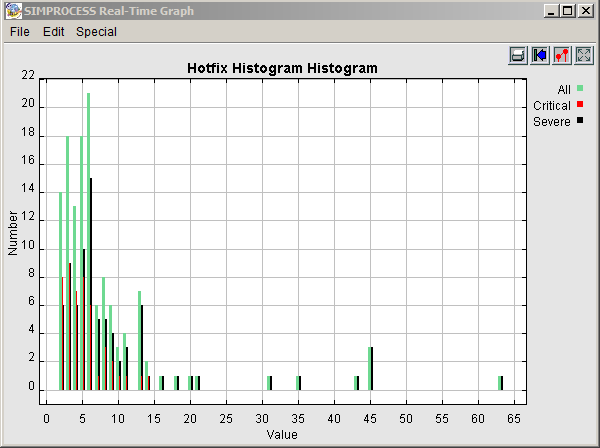
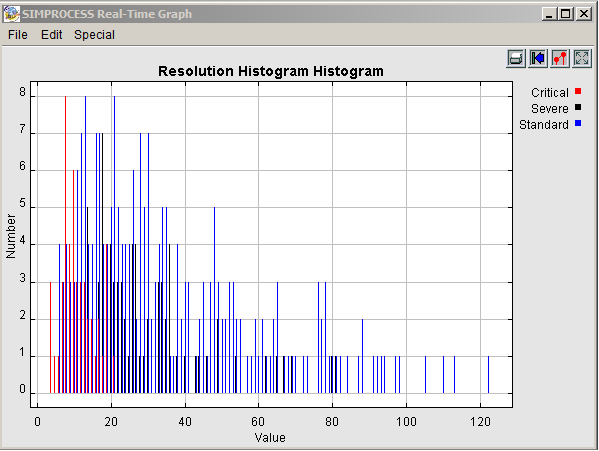
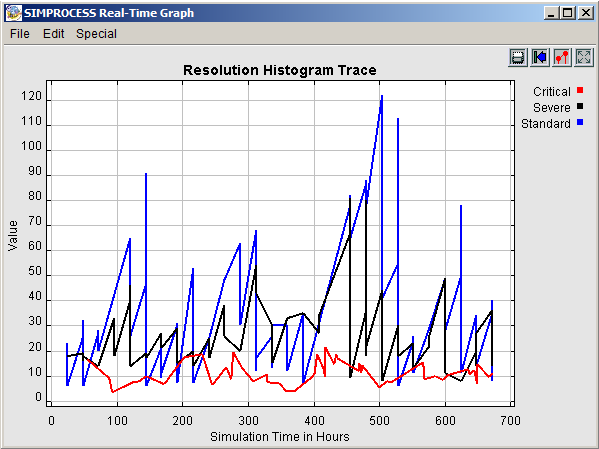
In the following histograms, we see the individual hotfix and resolution times (in hours) categorized by incident severity for the 1-2-4-2 configuration.
As we can see, the results are encouraging. The times for critical incidents are very consistent with no spikes at all. While we can see occasional spikes for lower-priority incidents, eliminating those would require deploying multiple additional resources which does not seem to be worth the cost.
There is however one thing that we need to address at this point. While a reasonable amount of incidents that exceeds the SLA terms is standard, the hotfix times for critical incidents are consistently higher than in the bank-proposed SLA terms. This is not caused by “waiting for resources”, but by structural inability to deliver such fix times by the current process. This can be seen from that the fact, that while the average resolution of a critical incident is 11.11 hours, this figure composes of 7.98 hours of processing and only 3.13 hours of waiting. This facts need to be communicated to the bank and an attempt to raise the fix time of critical incidents to a more acceptable level (e.g. 6 hours) needs to be made.
Preventing Incident Accumulation
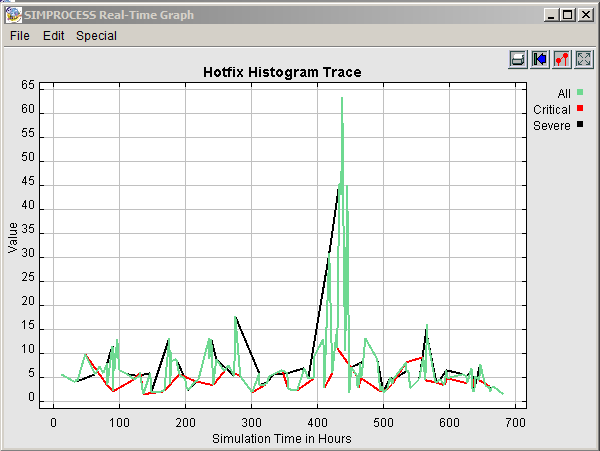
The last important metric we will consider is the chronological development of average hotfix and resolution times. While these times do not need to be absolutely stable over time (with the exception of critical incidents, where there is very little room for error), there should not be a tendency of higher values in time, as that would indicate that the system is getting backed up and might collapse at some point in the future. Let’s see the results for the 1-2-4-2 configuration.
While one cannot call the results stable, the spikes always seem to return to an acceptable value making the system stable over longer periods of time.
SLA Contract Pricing
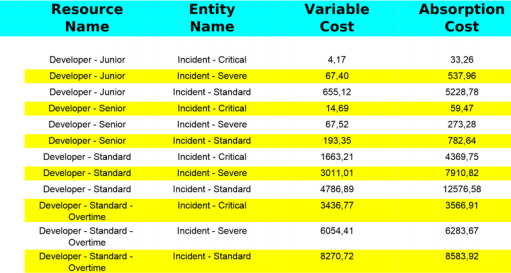
The total cost of upholding the SLA contract, excluding SLA violation-related penalties is 78432 EUR per month. The cost breaks down as follows:
On top of that, we must calculate a risk margin to cover the SLA violation penalties.
As part of the simulation, it became clear that the SLA hotfix and response times and penalties need to be recalibrated in several ways
- Some of the times are simply unrealistic due to the current support process
- The bank provided the hours in the 8x5 mode (“business hours”), while the developer operates exclusively in the 24x7 mode
- To prevent double penalty billing for incident, when the hotfix time exceeds the allowed resolution time, only the resolution time penalty will be billed from now on
- The resolution time penalties will be dropped by ¾ and differentiated from hotfix time penalties
The updated proposed SLA times are:
| Incident Type | Hotfix time (hours) | Resolution time (hours) | Hotfix penalty (per hour) | Resolution penalty (per hour) |
|---|---|---|---|---|
| Critical | 8 | 24 | 1000 EUR | 250 EUR |
| Severe | 24 | 72 | 400 EUR | 100 EUR |
| Standard | - | 168 | 100 EUR | 100 EUR |
For these times, the estimated monthly penalty is 62750 EUR. Source data can be found here - File:Appreciation.xlsx With a 20% risk margin, that makes the absolute risk margin 75300 EUR.
That brings the total contract price to 153 732 EUR per month.
Source Code
The source code can be found here - File:SoftwareSupportLifecycleModel.zip
