Poker probabilities and variance simulation
Introduction
The goal of my research, called „Poker probabilities and variance simulation“, is to make an own simulator tool in a traditional programming language, which will be able to simulate winning probabilities of starting poker cards. The main part of the research stands in graphical outputs of the simulator. The program will be able to produce graphs, which will be showing the results variance during Monte Carlo simulations of compared starting cards. This research describes the technology used for producing the tool and provides the readers with graphical results. I decided for the poker topic because it’s my favourite card game. And as a software developer, I see making an own simulator as a challange. The code itself is hosted as a .zip file, link provided.
• Project name: Poker probabilities and variance simulation
• Class: 4IT496 Simulation of Systems (WS 2014/2015)
• Author: Marian Zikmund
• Model type: Monte Carlo
• Technologies used: Programming language JavaScript (NodeJS), software MS Office Excel 2013 for small tables
Method
In this part, the technogolies, which were used for making the simulator, are described. The simulator is accessible as a webpage (Single page application).
The programming part of this project can be divided in two parts – frontend and backend. For the frontend, languages HTML, CSS, JavaScript and CoffeeScript, with libraries Bootstrap, jQuery and D3.js were used. The project is built to make the possibility of counting the results both on the frontend in the browser or on the backend server. That is possible thanks to the sharing of the same JavaScript code on the server and in the browser. Technologies NodeJS, Gulp, CoffeeScript and Browserify are used to make this happen.
Programming workflow was as follows:
Setup the whole project
By this, several small procedures are meant. It is necessary and practical for later faster development to initiate a Git repository (for version control) and set the development environment correctly. I chose NodeJS environment as the most suitable one for this task. When starting a new project using NodeJS, it is very useful to use a tool called Gulp. It makes all tasks, which need to be made periodically, automatic.
Make the user interface
The UI is simple, using the classical Twitter Bootstrap CSS framework,which makes it look clean and simple. Therefore, no graphical tools (like Adobe Photoshop) were needed.
Develop frontend JavaScript code
All the code was written on the server side in NodeJS environment. To make this code usable in the browser, it had to be compiled and bundled. That was made automatically by the Gulp and Browserify tools. Most of the code was even written not in the JavaScript itself, but in the CoffeeScript, a language, which has to be compiled to the JavaScript before running (it was also made by the Gulp tool).
Develop backend JavaScript code
Backend JavaScript code also runs in the NodeJS environment. In this part, it was necessary to sketch used files (classes) and remember the dependencies. The actual Monte Carlo simulation strategy was also made in this part – further described in the next part called „Model“.
Glossary of the described terms:
HTML, CSS – the simulator works as a classical webpage, which can be opened in a web browser, so these technologies are necessary
JavaScript - to make the application interactive on the client-side (in the browser), JavaScript is the only possible technology to use nowadays
Git – version control
CoffeeScript – language, which has to be compiled to JavaScript. Widely used for it’s beautiful syntax and faster coding possibilities
Gulp – tool for automatization of repeatedly maked tasks
Browserify – tool for transforming server side JavaScript to a front end JavaScript
NodeJS – server side environment for JavaScript code
Twitter Bootstrap – frontend CSS framework for easier coding without caring too much about the design
User interface
New simulation
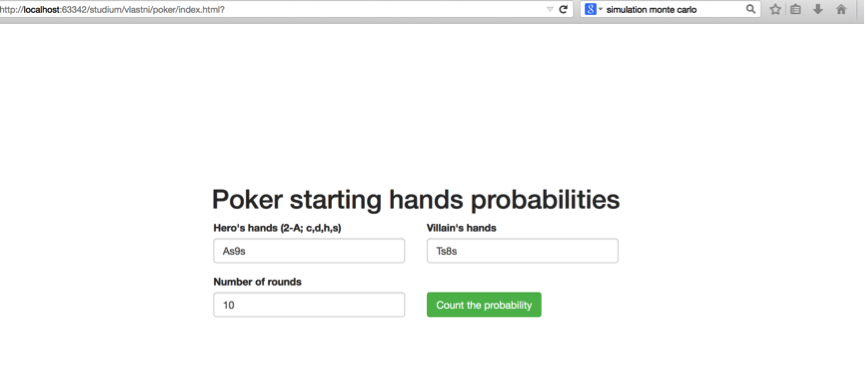
When a new sumulation is being configured, the user interface is maximally simple, al lit asks for are the Hero’s preflop cards, Villain’s preflop cards and number of rounds to simulate (Monte Carlo method).
Results of the simulation
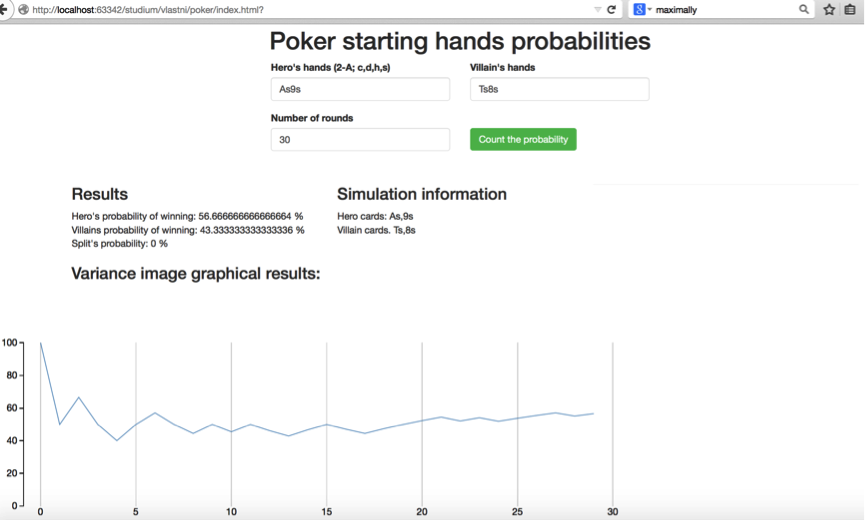
After the simulation is started (clicking on the „Count the probability“ button), whole box smoothly travels to the top (to make more space), and the result percentages and graphics appear.
Model
This is the actual structure of the simulator and the description of its logic:
The main classes: App – Simulate – AllCards - GenerateCard
The JavaScript actually doesn’t have classes like more traditional languages (like Java), but for the description, it is possible to call these files classes, they work as the classes in the same sense.
At the beginning, the user provides the application with the starting hands for two players (these are the hands, for which strength we are looking for). These are the starting parameters of the simulation. After this, an XMLHttpRequest is being made on the server, with exactly these parameters, plus the number of rounds for the Monte Carlo simulation. These parameters get to the main class – App. Here, the method simulate(parameters) from the class Simulate is invoked.
Class Simulate
This class has the main method simulate(parameters), which invokes method play(parameters) with the same parameters. Method play is the bootstraping part. It calls the methods makeBoard(startingCards) and getBoard() on the class AllCards.
Class AllCards
The two main methods here are makeBoard(startingCards) and getBoard(). As static variables, an array of all possible cards in the game is made. When the function makeBoard(startingCards) is invoked, it makes a new array of randomly generated cards. The parameter startingCards are the cards, already being held by the two players (the compared cards), therefore these cards cannot be generated anymore. This function also „generates“ the five cards on the board (as in the Texas Hold’em variant of poker game). It does so by calling method addCard(cardsAlready,allCards) from the class GenerateCard.
Method getBoard() simply returns the array with the randomly generated cards on the board.
Class GenerateCard
The main method of this class is AddCard(cardsAlready, allCards). The first parameter is supposed to be an array with cards, which cannot be generated anymore (are either in the player’s hands or generated in the preceding generating for the board). Parameter allCards stands for all the possible cards in the game, as being defined earlier.
Class Server
This is the hearth of the server side of this simulator. After calling the script from the frontend part via AJAX, the method http.createServer() is invoked. At the beginning of this method, the basic parameters of the simulation are read: heroCards, villainCards and rounds for Monte Carlo simulation. Knowing these, the actual simulation may begin. This method contains a loop,which is run as many times as it is set in the rounds property. Each iteration, the board is generated (as described in the AllCards class). For each of these iterations, the result has to be counted. By the result, I mean – who wins this current round (iteration). This number is held in the property herowon. In the end, we get the percentage by dividing the property herowon by the number of rounds.
For comparison of the cards strengths, a special module called „poker-evaluator“ is used. It was made a school project by a student from the USA. It is just a small class, with a main method evaluate(hands[]), which takes all of the cards and calculates the best possible combination and returns a value of its strength. This is made for both players and the one with higher value wins.
Results
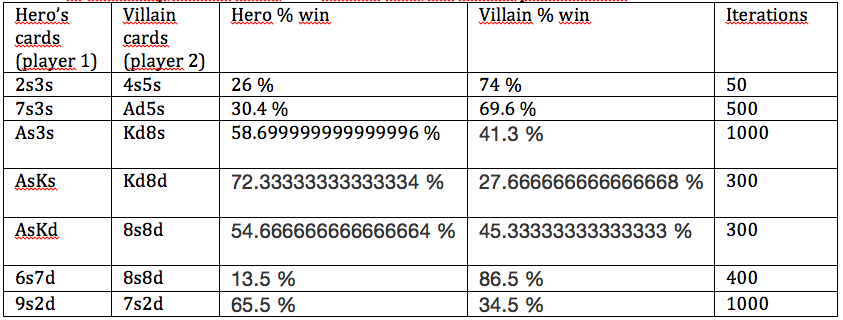
Table of randomly chosen cards and rounds with the results probabilities:
Graphs showing randomly chosen cards and how the variance is reduced with the number of simulated rounds (using Monte Carlo method, results of player 1 – hero - shown ):
As9s vs. Ts8s, 10 rounds, 80%
Ts9s vs. 7h4d, 30 rounds, 63,333333%
JsJd vs. Ah2d, 100 rounds, 76%
QsAd vs. Kh5d, 500 rounds, 65.8 %
Conclusion
The simulator provides the requested results with an automatically generated image line graph for variance demonstration. The simulator tool itself can be downloaded directly from the provided GitHub directory (beware of the necessity of having NodeJS preinstalled).
It is interesting to see the numbers of iterations, which are necessary for the Monte Carlo simulation to provide us with at least a quite precise result.
Code
You can view the prepared code, with necessary plugins and so on here: https://dl.dropboxusercontent.com/u/63085939/poker.zip (it is only necessary to have NodeJS environment preinstalled).
Resources
https://github.com/mbostock/d3/wiki/Gallery
https://github.com/chenosaurus/poker-evaluator
http://www.codeproject.com/Articles/569271/A-Poker-hand-analyzer-in-JavaScript-using-bit-math
http://www.pokerology.com/lessons/starting-hand-selection/
http://www.goldsim.com/Web/Introduction/Probabilistic/MonteCarlo/


