Fertility vs Intelligence
Simulation by Vojtěch Zrůst
4IT496 Simulation of Systems (WS 2013/2014)
Demographic studies have indicated that in humans, fertility rate and intelligence tend to be inversely correlated - the more intelligent (measured by IQ tests) a person is, the lower total fertility rate it exhibit. Survival rates are also correlated with IQ. Does this mean, that the humans get dumber than they are now?
Contents
Problem definition
How would the population evolve if the fertility was dependent on IQ? And if not? Would groups with higher IQ became small, insignificant or non-existent? Is there some equilibrium point?
Method
It is very probable that the population in which the fertility is inversely correlated with IQ will experience decreasing of overall IQ while in population where the fertility is not dependent on IQ should not experience such a thing. We can expect that highly intelligent people will not become extinct, but their number will decrease significantly. I also think that an equilibrium point exists, the point from which the IQ and fertility are in perfect harmony, point from which the population should not experience decreasing of IQ any more.
For the simulation I use NetLogo 5.0.4
Further description
2.1 Researches
There are several papers studying dependence of fertility on the intelligence. For example brilliant study of Gerhard Meisenberg (see [9]) that concerned country level fertility depending not only on IQ, but other factors like education, politics etc. According Gerhard's findings the dependence of fertility on IQ is linear; the fact makes prior researches, from this point of view, of course, valid. E.G. Daniel Vining's research from 1982 in which he discovered high negative correlation of -0.86 [10] (this result has been further questioned, nevertheless, the usage of Pearson correlation coefficient is justified).
In researches, data sets that were used are not available for the public, therefore it is not possible to inverse the process and gain fertility values for particular IQ. (It would require development of one more simulation and acquisition of data through it's tuning – “trial and error”). Even with the data, the task would probably be way over the course time complexity. Therefore, I have decided to introduce a slider that bears "level of dependence" with which it is possible to watch the impact of increasing dependence.
2.2 Tuning
When implementing the simulation, I have decided to amplify certain values (dependencies) in order to reach the results sooner with greater emphasis. The main reasons were a) the slow performance of Netlogo b) usage of ticks as a day → one full generation (there can exist more generations in the same time, but lifetime of one generation would be approximately the number mentioned further) can last about 30,000 ticks c) to be able to actually “see” the results (plots in the simulation) d) to avoid implementing immigration: after implementing the simulation with real numbers without the amplifying numbers the population was dying out (As it is happening in a real world as well). The numbers that have been tuned are devised on prior simulations and observations (e.g. observation of the percentage of coupled people).
2.3 Data
Related to
All numbers and statistics are taken from the Czech Census Bureau (Český statistický úřad) or related to the Czech Republic, therefore the project considers our country population as the one being simulated. The data were used simply because they are easily available in Czech Republic; they all can be taken from this one country, hence the model is more consistent.
Male/female ratio
At the beginning of the simulation as well as whenever new child is born it is necessary to determine sex of the subjects. According to [1] 1,086,343 children have been born alive in 2003 - 2012. From that, 557,172 males and 529,171 females. Therefore I created this code:
to set-determine-sex [person]
 ask person [
   ifelse random 1086343 < 557172 [
     set sex "male"
   ] [
     set sex "female"
   ]
 ]
end
to determine the sex of a newborn child. Random will pick a (random) number between 0 and 1086343. If the number is below 557172 the sex of the newborn child is set to „male“, otherwise the child is set to be a female.
Average IQ
According to [2], almost all modern IQ tests use 100 points as a default average IQ with 15 points as the standard deviation. In this experiment, I use 110 IQ of the people at the beginning. Then, the IQ will evolve naturally and after reasonable number of steps (after several generations) this initial setting should have negligible impact on the current population intelligence. Still I have chosen 110 that is closer to statistics all over the internet (none can be confirmed, the sources are companies doing IQ tests but in their review the plain value is usually just a number, no explanations, no conditions). The initial IQ for each person is determined with the following code:
set IQ random-normal 110 15
Life expectancy
This value is not significant for this experiment considering the people that die after already having all children or after becoming infertile. It may happen, however, that a person dies sooner before he manages to have children. To take this fact into account, as well as the fact that at the end of the simulation the still living “potentially” dead people might affect the result, I have introduced life expectancy at the moment of birth. When a child is born, the simulation (see code below) calculates the age in which the person will die. This option is more acceptable than other options (post calcul. or so) because otherwise each person would have to have calculated the comparative age of death, each tick. Moreover, this comparative age would be different each tick. Furthermore, current implementation allows future enhancements like increasing life expectancy through time (as the population becomes more civilized, etc.). Code that assigns life expectancy value (max-age variable):
to set-max-age [person]
 ask person [
   let expectancy 80.88
   if sex = "male" [ set expectancy 75 ]
   let calc-max-age random-exponential expectancy * 365
   ifelse calc-max-age > 95 * 365 [
     set max-age 95 * 365
   ] [
     set max-age calc-max-age
   ]
 ]
end
Expectancy for male is set to 75 years. For female it is 80.88 years (see [3]). Since each tick is 1 day, the values must be multiplied by 365 days. All values above 95 years are substitued with exactly 95 years since it is very improbable for people to reach higher age, in addition these people could suffer from typical old age disease like dementia and therefore their IQ couldn't really be counted (either way we are dealing with insignificant statistical group for this simulation, it just seemed logical to eliminate these exceptions).
Partnership
According to [4] there is 2,193 thousand one-couple families in the Czech Republic, that makes 4,386,000 married people → in this project I will take these as life partners (there are also not married couples with children, but there is no statistics about it). Let's say, then, that approximately 40% of population is in life-partnership. (The number seems to be low, but in [5] you can see that, for example, 1.5 million people are kids.) The general probability to become a life partner of someone else is then 0.4 divided by number of people one meets, on average, in lifetime. This number has been acquired during the prior simulation and is set to 10,000 as this number showed best results when comparing % of coupled population (+ as a prevention of dying out). Further conditions:
- one can't become a life partner if he is not older than 15 years
- two same sexes can't become life partners (in gay couples, there is only adoption, maybe surrogacy, but it doesn't deal with fertility directly, therefore this is logical problem relaxation)
- the probability of two people to become life partners is higher the closer their IQ is
- the probability of two people to become life partners is higher the closer their age is
- the highest probability to get married is around 30 for man (see [6]) and 25 – 29 for woman (see [7])
IQ of a child
First IQ of parents is averaged – that is the IQ kid inherits. Then mutation occurs. For the mutation (plus/minus IQ points) I have used normal distribution of IQ points with mean equal to zero and standard deviation equal to 20; see code below:
let child-IQ ceiling (male-IQ + female-IQ) / 2
set child-IQ child-IQ + ceiling random-normal 0 20
child-IQ was first filled with average and than increased or decreased by mutation. IQ is always handled as integer in this project (to explain the ceiling procedure).
Fertility
According to [8], total fertility rate is 1.452. That means that each woman is assigned 1.452 of children. Since only approximately 40% of women are married (so far we are not considering single mothers), it means that each of married woman bears (under the same conditions as when the rate was measured) approximately 3.63 of children. Code:
let IQ-factor (110 - female-IQ) * fert-IQ-dependency * 10
     if random 35 * 365 * 100 <= 363 + IQ-factor
The IQ factor is calculated by IQ difference from mean value and multiplied by dependence chosen by user. To further highlight the effect I have added another multiplication.
Results
Run 1
Settings
- fert-IQ-dependency = 0 (no dependency)
- total ticks run: 50,000 (2 whole generations, can be up to 12 overlapping generations)
Output
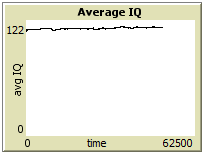
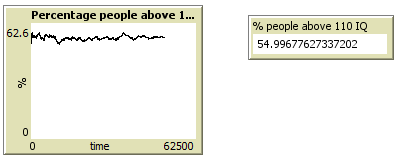
From the graphs above we can clearly see that in this case the IQ of the population even slightly increased. At the beginning the % of people above 110 was around 50% (according to the normal distribution set in the simulation) and it stayed so - 55% as a final result after 50,000 ticks (12 generations).
Run 2
Settings
- fert-IQ-dependency = 50 (middle dependency)
- total ticks run: 100,000 (3 whole generations, can be up to 18 overlapping generations)
Output
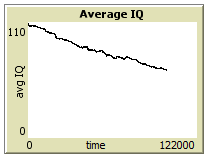
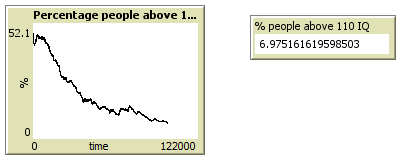
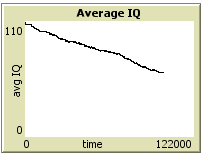
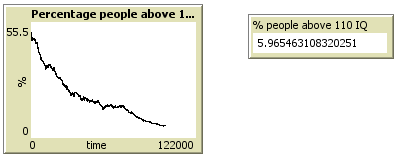
From the graphs above we can see that middle dependency caused rapid decrease of people over 110 IQ. The percentage of such people dropped on devastating level of 7% in approximately 12 generations. (Such rapid decrease is the result of conditions above, for further explanation see conclusion). Average IQ decreased down to value around 60.
Run 3
Settings
- fert-IQ-dependency = 100 (absolute dependency)
- total ticks run: 100,000
Output
Average IQ is around 60 again, after 100,000 ticks. The percent above 110 is slightly lower than in run 2 and as I was observing it, it oscilated around this value for last 20 minutes of the simulation (approximately last 15,000 ticks). This could be close to our equilibrium point then.
Conclusion
The graphs showed us that even a partial dependence can have a significant result. We must keep in mind, however, that this simulation works with amplified values and the amplification has been done in matter of thousandfold, therefore what happens here in 20 generations can happen in several thousand generations in the real world. And that would actually confirm theories of Retherford and Sewer or others that predicts decrease of less than one IQ per generation.
Average IQ around 60 and 6% of population over 110 IQ seems to approximate the equilibrium point, but we needn't fear, because the simulation didn't take into account other attributes that correlate with IQ or fertility like education. In fact, education is one of the most important dependent variables of IQ, because it's this one that actually caused the rapid increase of intelligence (since times when the obligatory school attendance has been introduced).
To conclude the results, the population IQ will decrease slightly over generations unless a new factor will enter the game or another factor would become strengthened or weakened. The group of clever people (above certain value) won't die out, it just gets smaller and as history proved, true genius can come at any time.
Code
Resources
[1] Český statistický úřad, Births by vitality, by sex, by legitimacy: 1950 - 2012, [ONLINE] available at http://www.czso.cz/csu/2013edicniplan.nsf/t/8E00179817/$File/4032130601a.pdf
[2] Wikipedia.org, Intelligence quotient, [ONLINE] available at http://en.wikipedia.org/wiki/Intelligence_quotient
[3] Český statistický úřad, Life expectancy: 1920–2012, [ONLINE] available at http://www.czso.cz/csu/2013edicniplan.nsf/t/8E00179823/$File/4032130806.pdf
[4] Český statistický úřad, Households by 1961 – 2011 censuses, [ONLINE] available at http://www.czso.cz/csu/2013edicniplan.nsf/t/8E001797C7/$File/4032130301.pdf
[5] Český statistický úřad, Population by main age group: 1920 – 2012, [ONLINE] available at http://www.czso.cz/csu/2013edicniplan.nsf/t/8E001797D4/$File/4032130109.pdf
[6] Český statistický úřad, Marriages by age of groom: 1950 – 2012, [ONLINE] available at http://www.czso.cz/csu/2013edicniplan.nsf/t/8E001797C6/$File/4032130401.pdf
[7] Český statistický úřad, Marriages by age of bride: 1950 – 2012, [ONLINE] available at http://www.czso.cz/csu/2013edicniplan.nsf/t/8E001797C4/$File/4032130402.pdf
[8] Český statistický úřad, Fertility rates by age of female: 1950 – 2012, [ONLINE] available at http://www.czso.cz/csu/2013edicniplan.nsf/t/8E001797C5/$File/4032130609.pdf
[9] Gerhard Meisenberg, Wealth, intelligence, politics and global fertility differentials, 2009, Cambridge University Press, doi:10.1017/S0021932009003344
[10] Vining Drj, On the possibility of the reemergence of a dysgenic trend with respect to intelligence in American fertility differentials, 1982, Intelligence 6 (3): 241–264, doi:10.1016/0160-2896(82)90002-2
