Evacuation from a custom building
Intro
This model simulates evacuation proccess of any building specified by simplified blueprint plans. It allows user to visualize how evacuation is done in the building and lets him find out how many people can make it out in a certain time limit.
The purpose of the simulation is to find out how many people can be inside the building to safely escape in a certain time limit.
Software
Simulation is created using Netlogo 6.0.2.
The Model
Importing a building plan (blueprint)
The first step of the simulation is importing a building plan. The UI requests the user to upload a file from which colors of patches in netlogo are imported. This step specifies the building layout. It determines wheater it is a wall, door, exit or walkable path.
The Setup
After setup button is pressed the program runs series of calculations to find the path out. It finds all corners in the plan and detects rooms. When rooms are detected the program finds all exits and doors in those rooms. It asigns values to all patches in the way based on distance to exits or doors in the room that are closest to a exit. Agents than follow the path.
Values asigned are stored until building plan changes. This allows the program to calculate the way only once when a plan gets imported. First setup will take a while because of calculations. Also when plan gets changed the program needs to recalculate of course.
The Simulation
Because the blueprint can be different everytime the core of the problem was to detect rooms automaticly and simulate people acting inside of them. The walls and doors in a room are the only thing that people can actualy see, when they are inside of them. So people will escape through exits that are in the room, rather than go through one door eventhough there is a closer exit. Simply because they see the one in the room first. When people are stuck with clusters, the clusters move slowly, this means that more people causes the evacuation to slow down.
So the simulation process is finding the balance between time that evacuation takes and allowed number of people for evacuation to be successful in certain time limit.
The simulation ends when time limit is reached or when all people got out of the building so you can see the exact number of evacuated people or the exact time of getting all of them out.
How to use the program
First the building blueprint needs to be imported. The application comes with three sample blueprints, it is possible to create one of your own (Guide at the end of the chapter).
The UI consists of Three buttons one slider and two dropdowns to set timelimit.
Upload a building plan button
This button lets you choose a file to be imported as blueprint, it must be 100x100px.
People inside the building slider
Let's you set up how many people will be in the building before simulation starts.
Time limit drop downs
Let's you set up time-limit. The simulation ends when time limit is reached so you can see how many people got out and how many people are still in the building.
Setup
When setup is pressed the program calculates a path if building plan was changed and populates the building with people.
Evacuation
This button runs a simulation.
How to create a blue print
Draw a schema of a building in size of 100x100px.
Each pixel represents a patch in netlogo. Colors to use are the following:
 * Black
   * HEX CODE: #000000
   * NETLOGO CODE: 0
   * REPRESENTS: Walls
 * Grey
   * HEX CODE: #8d8d8d
   * NETLOGO CODE: 5
   * REPRESENTS: Doors
 * Red
   * HEX CODE: #d73229
   * NETLOGO CODE: 15
   * REPRESENTS: Exits & windows
 * Blue
   * HEX CODE: #2d8dbe
   * NETLOGO CODE: 95
   * REPRESENTS: Walkable path
Monitors
Time passed
Shows the time since the simulation started.
# of people inside
Shows the current number of people that are still inside the building.
# of people evacuated
Shows the current number of people that left the building.
The plot (people evacuated from the building)
Shows the progress of the number of people evacuated over time.
Results
The simulation has been run multiple times with different number of people inside and different building plans. Average escape time, deviation and maximum escape time where extracted from messuared data. All details including graphs can be found in File:Sim-results.xlsx where every blueprint has its own excel tab.
Interesting numbers to look at were deviation of escape time which was highest at density of two hundred people. This could mean that two hundered people are certain break point where the evacuation starts to slow down. The same thing applies on blueprint #2 as well. However in the third blueprint deviations are high at the begining and than it falls down, which means that evacuation is fastest when there are less than hundered people inside.
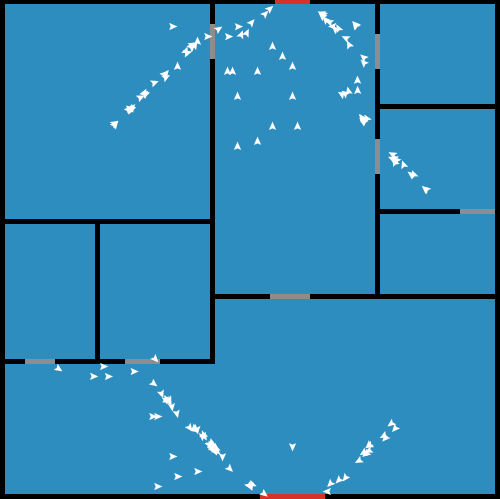
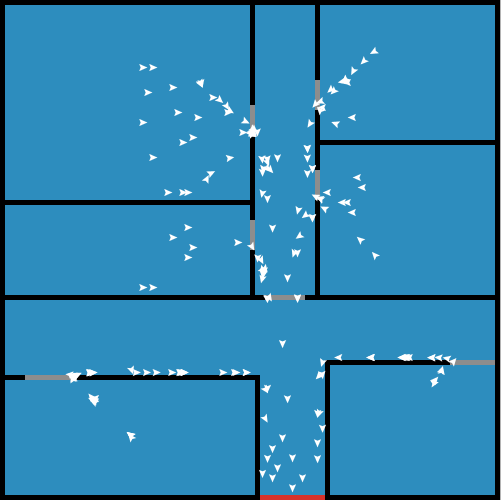
Screenshots from the simulation:
Conclusion
The first blueprint has the best layout to escape, there are lots of exits and ways out are fast. It beats the average and maximum escape time in the next to blueprints. Second blueprint is in the middle and the third has the worst layout because people have to go around the rooms besides the exit, they cumulate by the door and than travel in clusters through the hallway very slow.
Files
The application
Sample blueprints
Blueprint guide
It is in .zip because .txt files are not allowed
Results of simulation
Download all in a ZIP file
Note: You'll be asked to specify the file when uploading blueprint, however it is better to have all in same directory.


