Conceptual Graphs
Contents
Introduction
Conceptual graphs or CG’s are graphical presentations of complex systems of logic. They visualize logic information in a way that is logically precise, humanly readable, and computationally tractable. They make complex systems and difficult calculations clear and readable while remaining a formal design and its own specific language. They are a combination of philosophical, psychological, mathematical and linguistic theories which makes them especially attractive for all sorts of tasks, which we will talk about later on.
History
Conceptual graphs were first introduced by John F. Sowa 1976 and are based on the former known existential graphs of Charles Sanders Peirce and semantic networks used in artificial presentations. Earlier in the 20th century attempts were made for graph based notation. Semantic nets, Dependency graphs and correlational nets are some examples of these graph based notations. The problem with these structures is that they could never fully express full first-order logic. There was always something missing in these structures that could be fully captured with the introduction of the conceptual graphs.
Basic Definitions
Concepts and Relations
The most basic definitions in a conceptual graphs are the concepts and relations. The basic structure of a conceptual graph is displayed and following image:
This image tells us 3 things. There are two concepts that are connected through a certain relationship and that relationship should be read in the following way: “The relation of a Concept_1 is a Concept_2”. The reading direction is decided by the arrow. This structure shows us the immediate comfort that a conceptual graph provides. An alternative form of showing could be ‘linear’ text-based. This would look like this:
[Concept_1] -> (relation) -> [Concept_2].
This will be read in the same way as the above displayed graph but immediately looks a lot more difficult. The ‘.’ At the end of the above statement signals the end of a particular graph. Let’s take a look at a concrete example that we will use throughout the entire explanation. It covers the topic requesting funding for new business topics within a fictitious company. Let’s work with the linear forms first. We will put them in concrete graphs later on.
[Funding_Request] -> (initiator) -> [Employee].
This reads as follows: “The initiator of a funding request is an employee.”
Referents
The above statement is very broad. Any employee could be the initiator of any funding request. We make the example more particular by adding referents to the concepts. These referents refere to a particularity within the concept. This can be a person or particular instance. For example:
[Employee: Anna].
Refers to not just any employee but the employee named Anna. If there are two or more Anna’s within the system we can distinguish them more from one and another by adding a number for example.
[Employee: Anna#1].
The referent can be seen as a conformity of the specific concept or type label in which it is placed. For example Anna conforms to the type label of being an Employee. Concepts that don’t have any individual referent are called type labels with a generic referent. For our concrete example we could write the following statement:
[Employee: Anna#1] -> (initiator) -> [Funding_Request#1553].
Hierarchy
Within Conceptual graphs type labels or concepts have a certain hierarchy. Linear this is explained in the following way:
Manager < Employee.
This means that every manager also an employee is or in other words: Manager is a more specialised type is of the type Employee, Manager is a subtype of Employee and Employee is a supertype of Manager. We could lead this further to the statement that an employee is for example also a person, a person is an animal, an animal is an entity and so on. This will ultimately trace back to the following statement.
Entity < T.
Where ‘T’ can be seen as the universal supertype. It has no supertypes and is therefore, by Sowa’s definition the most general type. A concept can have more than one supertypes. This means that it will inherit all the characteristics of these supertypes.
Projection and combining graphs
Using referents and hierarchy can lead to more specialised conceptual graphs. More concepts, types and/or relations can be added. For example within previous example we could say that funding request is the outcome of a company policy. This will lead to following linear statement:
[Funding_Request] - (initiator) -> [Employee] (outcome) <- [Company_Policy].
And to following Conceptual graph.
Subtypes can be substituted by supertypes, non-generic referents might be added to the graph… What we can conclude is that every graph may have a more general graph from which it was derived. We define Projection as looking at a graph and trying to trace back to see if the other graph is a generalisation of it. This is important because once a graph projects into another graph we might have identified a particular pattern within these graphs. Later we will discuss the issue of Inference in Conceptual graphs and go more into detail about the above stated. Now that we have stated the issue of projection, we can go even further and start combining different graphs. Maximal Join is the defined as the optimal method in which graphs are joined. This achieved when graphs are joined on the maximally extended, or most common, projection. Understanding example explains clearly the process of joining different graphs.
Yet when combining graphs we must be careful. It may lead to some false results. The problem is that any item will be suitable as a referent as long as it is conform the type for which it is used. An example could be that Susan is indeed a manager but works for a different company than P-H Co. (It is nowhere stated in this figure that she has to work for the company). This is where Inference comes in place.
Inference
Inference in Conceptual graphs is an important but complicated issue. It is based upon the existential graphs logic of Charles Sanders Pierce. We’ll start explaining Sowa’s thinking through Pierce’s logic. Suppose 2 graphs, Graph 1 and Graph 2, some outed graphs and suppose following statement about these graphs.
“IF Graph 1 THEN Graph 2.”
Which can be read as “If Graph 1 can project into outer graphs, then Graph 2 can be reached.” This means that to reach graph 2 we must first rub out graph 1. In Pierce’s logic following sentence would be written as:
Not (Graph 1 and not Graph 2)
And would graphically look like
This visually shows that some graphs might dominate other graphs. To completely define this we say that one graph is dominated by another graph if the dominated graph is ringed by a negative context (a box) whereas the dominating graph is outside of this negative context (box). So to reach Graph 2, Graph 1 must first be deiterated. What this means is that we must find a graph in the outer graphs so that graph 1 projects into this particular graph. This would leave 2 rings around graph 2.
This results in the statement: ‘not (not Graph 2).’ This is a double negotiation which free graph 2 so that it can be asserted. Graph 2 can thus be seen as true. What this example show is the first general inference rule. Namely that a true antecedent in an ‘if-then’ rule states that its consequent will always be true. This rule is called the general inference rule of modus ponens. In the same way we could also prove that if the consequent part (the ‘then’ part) of an ‘if-then’ rule is false then its antecedent will also be false (the ‘if’ part). This rule is called the general inference rule of modus tollens.
To conclude this means that if a graph is false, any of its specialisations will also be false. If “the company P-H Co.” is false, then “employee Anna is working for the company P-H Co.” will logically also be false. To finalise this section we will also discuss the “or” rule. If we consider the statement
Graph 1 or Graph 2.
This can be written in Pierce’s logic as: not (not (Graph 1) and not (Graph 2)) Or linear and less complex will look like:
((Graph 1) (Graph2))
Using the same logic as the above stated “if-then” rules we can say that either Graph 1 or Graph 2 might be true. If Graph 1 is true than Graph 2 will be false. If Graph 2 would be true than Graph 1 will be false. So the statement “Graph 1 or Graph 2” can also be written as “if not Graph 1 then Graph 2” Let us now demonstrate the use of modus ponens and modus Tollens in our actual example. Following figure states this clearly:
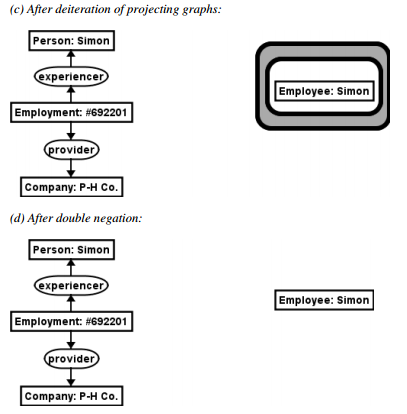
Point (a) shows us the starting outer graphs, graph 1 and graph 2. After specialisation in (b) we can see that graph 1 can be projected in the outer graphs because the first part of the outer graphs is exactly the same as our graph 1. Thus graph 2 can be reached and the double negotiation can be rubbed out (c). What this than shows is that if a person is an experiencer of employment, he is an employee. Or this shows us that if Graph 1 is true, graph 2 is also true in this example. To demonstrate modus Tollens we can think in the same way is stated above. Hence if Simon is not an Employee (if graph 2 is wrong) than he cannot be an experiencer of work (Graph 1 will be wrong too). Inference is thus the attempt into reducing the context in which concepts are visually dominating other knowledge elements.
Applications
As mentioned before in the introduction, Conceptual graphs can be used and are used to capture knowledge as a regular person understands it. It could be information about humans playing roles in events, knowledge about the functioning within a process or method, as a means of capturing the consequences of an action or as a reasoning about general objects in the real world. In the original paper by John F. Sowa, Conceptual Graphs were used for displaying information in a database interface. In general they are of key importance in several artificial intelligence applications. The use of models in informatics and artificial intelligence applications are of key importance to clarify the structure of an underlying problem. An architect does not start building a house and realises when it’s finished that the rooms are too small, the orientation is wrong… He starts with a model of the house to start with a basic structure which can be elaborated further and further into complex structures one step at the time. Just like the architect uses a model as a baseline structure, a database designer or in general everyone can use conceptual graphs to clarify how complex real-world problems function.
Example
The above stated examples were very simple and abstract and didn’t really fit within a picture of entire real-life problem. They were just used to demonstrate the elegance of Conceptual Graphs. Underlying example is a simple application of a real-world problem and tries to demonstrate how CG is been used in daily life problems. It’s simple enough to understand it yet practical enough to demonstrate the use of Conceptual Graphs. The example explains the use of Conceptual graphs into a company policy and comes from the paper “An introduction to Conceptual Graphs” by Simon Polovina. Suppose that a company needs to allocate budgets for funding requests made by their employees. The question now is how can they decide who gets his/her funding first? The company wants to encourage younger employees to make such requests. To support this motion, the company has decided to allocate budgets in the following order: Junior Staff, Senior Staff, Manager and last but not least Director. Understanding conceptual graph explains the seniority relationships within the company.
To be complete we also give the type hierarchy:
Junior_Employee < Employee Senior_Employee < Employee Director < Employee.
A more general conceptual graph shows us the general applicability of seniority.
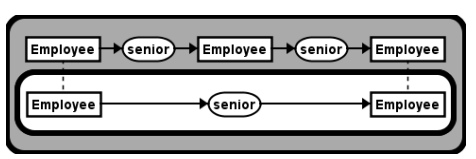
Note that this consists of 2 graphs. If graph 1 (above stated statement) and graph 2 (the shorter statement). Using specialisation, maximal join and inference we can project graph 1 of the above standing figure with the outer graphs of the seniority relationships within the company. Let’s write this down in linear form:
[Junior_Staff: Robyn] -> (senior) -> [Senior_Staff: Simon] -> (senior) -> [Manager: Lucy].
So we can deiterate graph 1 in this figure. This means that Graph 2 is true. This means that following statement is true:
[Junior_Staff: Robyn] -> (senior) -> [Manager: Lucy].
This in turn can be maximally joined with the 3 graph from the original seniority relationships within the company. Which leads to following statement:
[Junior_Staff: Robyn] -> (senior) -> [Manager: Lucy] -> (senior) -> [Director: Richard].
In turn this than can be treated in the same way as before (using specialisation, deiteration and double negotiation) to come to the following statement:
[Junior_Staff: Robyn] -> (senior) -> [Director: Richard].
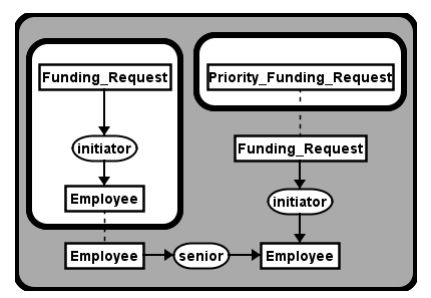
Now with this complete knowledge background we can draw a Conceptual graph for the priority of funding looking like this:
Let’s go through this graph: If a funding request is initiated by a more senior employee then that will become a priority request if there is no other request from a less senior employee. To express the simplicity of this example let us question what happens when two persons with the same level of seniority propose a funding request. A new Conceptual graph might reflect on this and for example give priority through a panel of judges, through working days in the company… This way it will come closer to the actual real-world problem it tries to solve.
Conceptual Graph Interchange Form (CGIF)
For clarity reasons we have used linear forms to represent the Conceptual graphs in words. For more complex problems, Sowa developed a universal language for expressing problems in CG. This was also base on the research paper of Pierce and is called Conceptual Graph Interchange Form. Let’s say for example that we want to express following statement: “Max the dog is on the mat.” In CGIF this would look like this:
[Dog Max] [Sitting *x] [may *y] (agent ?x Max) (location ?x ?y)
This looks very complex and is difficult to read for someone who is not familiar with the syntax behind these words.
Sources
https://en.wikipedia.org/wiki/Conceptual_graph http://www.jfsowa.com/pubs/cg4cs.pdf http://www.jfsowa.com/cg/cgexampw.htm https://wiki.eecs.yorku.ca/course_archive/2011-12/F/6339/_media/conceptual_graph_examples.pdf


