Heat recuperation
The story is very, very simple this time. Imagine a flathouse full of people taking care of enviroment (e.g. Greenpeace headoffice). Those people know that they are wasting lot of energy by splashing hot water into the waste and they want to use heat stored in this water to create electricity. The problem is that nobody (not even Greenpeace H.O.) knows how much and how hot water is he wasting. The only "hard data" we are able to acqiure is information about how much hot and cold water was used in the flat. Task of this simulation is to simulate water flow in the house and try to predicate water (or wate water pipe) temperature during a week.
Contents
Problem definition
As an input I have recieved several datasets of water usage in specified house. From similar data sets every analyst using this model will be capable to specify mean and deviation of normal distribution for every peak and waterflow during the peak. The model will then simulate these distribution for several weeks.
By definition we assume that the pipe will have the same temperature as water last wasted. We also assume that temparature might be mixed by volume (that means that 1 litre of 50°C wather mixed with 1 litre of 10°C water will have 50°C * 1litre + 10°C * 1litre) / 2 = 30°C).
Outputs of the model will be:
- average, maximal and minimal temperature for every day
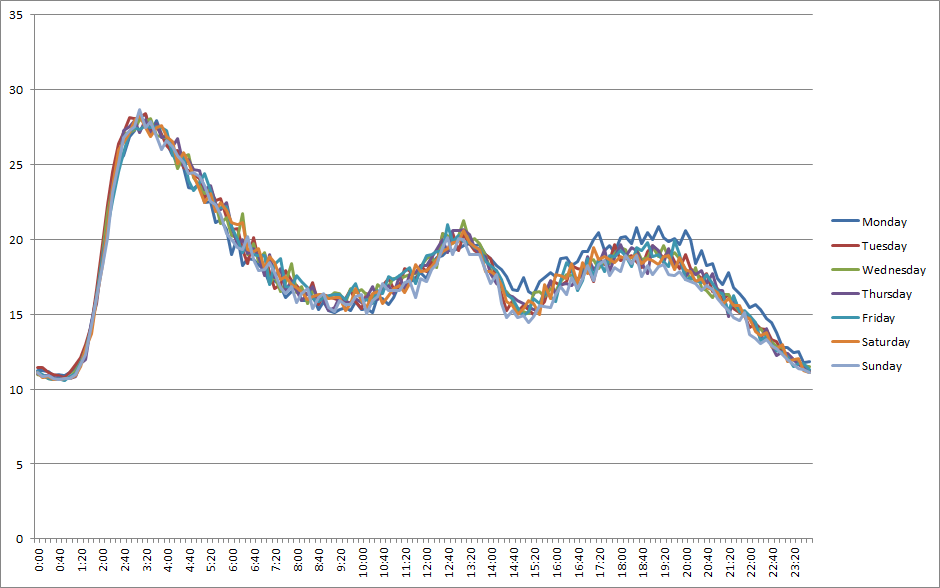
- average temperature for every hour during the week
- "raw data" for every 10 minutes in year
Method
I have decided to simulate those data in MS Excel. MS Excel is strong enough to simulate the model and is well known. This is important while the model might be used for simulation some real situation by ČVUT student(s).
While the abstraction is realy high, there will be no agents in the model, so no special software is needed.
Model
The model is very simple form description. User (analyst) may configure 4 variables and 40 normal distributions all located on "Settings" spreadsheet.
Varaibles
Hot water temp. (°C)
Sets temperature of water in "hot" pipe.
Cold water temp. (°C)
Sets temperature of water in "cold" pipe.
Mean temp. decrease
This variable is present to simulate that most of people will use hot water before they waste it (and decrease its temperatur in the process). To set up average value of this decrease you have to fill in this cell.
Maximum percent deviation
In this variable an analyst may set how much value of every step (10 minutes) might differ from each distribution. This is the parameter where you can differ deterministic model from non-deterministic one.
Distributions
You may set 20 different distirbutions for hot and 20 for cold water. All of those distributions are normal and you may set it's mean, deviation and total flow during the peak. You may as well choose just some weeks where the distribution is valid.
Model definition
Work of the model is realy simple. On the "simulation" sheet you can find 52 "weeks", each divided into 7 days and those days divided by 10 minutes. For every line (10 minutes) hot and cold water flow is counted by formula like below:
=(KDYŽ(A(C$1>=Settings!$B$10;C$1<=Settings!$B$11);Settings!$B$9*((1-Settings!$E$2)+(Settings!$E$2*2*NÁHČÍSLO()))*NORM.DIST($B3;Settings!$B$13;Settings!$B$14;NEPRAVDA);0)) + (KDYŽ(A(C$1>=Settings!$C$10;C$1<=Settings!$C$11);Settings!$C$9*((1-Settings!$E$2)+(Settings!$E$2*2*NÁHČÍSLO()))*NORM.DIST($B3;Settings!$C$13;Settings!$C$14;NEPRAVDA);0)) + (KDYŽ(A(C$1>=Settings!$D$10;C$1<=Settings!$D$11);Settings!$D$9*((1-Settings!$E$2)+(Settings!$E$2*2*NÁHČÍSLO()))*NORM.DIST($B3;Settings!$D$13;Settings!$D$14;NEPRAVDA);0)) + (KDYŽ(A(C$1>=Settings!$E$10;C$1<=Settings!$E$11);Settings!$E$9*((1-Settings!$E$2)+(Settings!$E$2*2*NÁHČÍSLO()))*NORM.DIST($B3;Settings!$E$13;Settings!$E$14;NEPRAVDA);0)) + (KDYŽ(A(C$1>=Settings!$F$10;C$1<=Settings!$F$11);Settings!$F$9*((1-Settings!$E$2)+(Settings!$E$2*2*NÁHČÍSLO()))*NORM.DIST($B3;Settings!$F$13;Settings!$F$14;NEPRAVDA);0)) + (KDYŽ(A(C$1>=Settings!$G$10;C$1<=Settings!$G$11);Settings!$G$9*((1-Settings!$E$2)+(Settings!$E$2*2*NÁHČÍSLO()))*NORM.DIST($B3;Settings!$G$13;Settings!$G$14;NEPRAVDA);0)) + (KDYŽ(A(C$1>=Settings!$H$10;C$1<=Settings!$H$11);Settings!$H$9*((1-Settings!$E$2)+(Settings!$E$2*2*NÁHČÍSLO()))*NORM.DIST($B3;Settings!$H$13;Settings!$H$14;NEPRAVDA);0)) + (KDYŽ(A(C$1>=Settings!$I$10;C$1<=Settings!$I$11);Settings!$I$9*((1-Settings!$E$2)+(Settings!$E$2*2*NÁHČÍSLO()))*NORM.DIST($B3;Settings!$I$13;Settings!$I$14;NEPRAVDA);0)) + (KDYŽ(A(C$1>=Settings!$J$10;C$1<=Settings!$J$11);Settings!$J$9*((1-Settings!$E$2)+(Settings!$E$2*2*NÁHČÍSLO()))*NORM.DIST($B3;Settings!$J$13;Settings!$J$14;NEPRAVDA);0)) + (KDYŽ(A(C$1>=Settings!$K$10;C$1<=Settings!$K$11);Settings!$K$9*((1-Settings!$E$2)+(Settings!$E$2*2*NÁHČÍSLO()))*NORM.DIST($B3;Settings!$K$13;Settings!$K$14;NEPRAVDA);0)) + (KDYŽ(A(C$1>=Settings!$L$10;C$1<=Settings!$L$11);Settings!$L$9*((1-Settings!$E$2)+(Settings!$E$2*2*NÁHČÍSLO()))*NORM.DIST($B3;Settings!$L$13;Settings!$L$14;NEPRAVDA);0)) + (KDYŽ(A(C$1>=Settings!$M$10;C$1<=Settings!$M$11);Settings!$M$9*((1-Settings!$E$2)+(Settings!$E$2*2*NÁHČÍSLO()))*NORM.DIST($B3;Settings!$M$13;Settings!$M$14;NEPRAVDA);0)) + (KDYŽ(A(C$1>=Settings!$N$10;C$1<=Settings!$N$11);Settings!$N$9*((1-Settings!$E$2)+(Settings!$E$2*2*NÁHČÍSLO()))*NORM.DIST($B3;Settings!$N$13;Settings!$N$14;NEPRAVDA);0)) + (KDYŽ(A(C$1>=Settings!$O$10;C$1<=Settings!$O$11);Settings!$O$9*((1-Settings!$E$2)+(Settings!$E$2*2*NÁHČÍSLO()))*NORM.DIST($B3;Settings!$O$13;Settings!$O$14;NEPRAVDA);0)) + (KDYŽ(A(C$1>=Settings!$P$10;C$1<=Settings!$P$11);Settings!$P$9*((1-Settings!$E$2)+(Settings!$E$2*2*NÁHČÍSLO()))*NORM.DIST($B3;Settings!$P$13;Settings!$P$14;NEPRAVDA);0)) + (KDYŽ(A(C$1>=Settings!$Q$10;C$1<=Settings!$Q$11);Settings!$Q$9*((1-Settings!$E$2)+(Settings!$E$2*2*NÁHČÍSLO()))*NORM.DIST($B3;Settings!$Q$13;Settings!$Q$14;NEPRAVDA);0)) + (KDYŽ(A(C$1>=Settings!$R$10;C$1<=Settings!$R$11);Settings!$R$9*((1-Settings!$E$2)+(Settings!$E$2*2*NÁHČÍSLO()))*NORM.DIST($B3;Settings!$R$13;Settings!$R$14;NEPRAVDA);0)) + (KDYŽ(A(C$1>=Settings!$S$10;C$1<=Settings!$S$11);Settings!$S$9*((1-Settings!$E$2)+(Settings!$E$2*2*NÁHČÍSLO()))*NORM.DIST($B3;Settings!$S$13;Settings!$S$14;NEPRAVDA);0)) + (KDYŽ(A(C$1>=Settings!$T$10;C$1<=Settings!$T$11);Settings!$T$9*((1-Settings!$E$2)+(Settings!$E$2*2*NÁHČÍSLO()))*NORM.DIST($B3;Settings!$T$13;Settings!$T$14;NEPRAVDA);0)) + (KDYŽ(A(C$1>=Settings!$U$10;C$1<=Settings!$U$11);Settings!$U$9*((1-Settings!$E$2)+(Settings!$E$2*2*NÁHČÍSLO()))*NORM.DIST($B3;Settings!$U$13;Settings!$U$14;NEPRAVDA);0))
This formula contains of 20 KDYŽ (IF) functions - one for every distribution:
- condition tests wherather the distribution is walid for this week
- if the distribution is valid then the model counts its value for this line (NORM.DIST($B3;Settings!$B$13;Settings!$B$14;NEPRAVDA);0) and multiple it by random number between 1-"Maximum percent deviation" and 1+"Maximum percent deviation" ((1-Settings!$E$2)+(Settings!$E$2*2*NÁHČÍSLO()))
To ensure that there will be no problem with parts of distribution "travelling" into next week, another 7 days for each week are counted and waterflow of those "weeks" are added to next week (starting from week 2).
The tampearature itsetlf is counted by much more simple formula:
=((E3*(Settings!$B$1-(NORM.S.DIST(NÁHČÍSLO();PRAVDA)*Settings!$B$3))+(F3*Settings!$B$2))/(E3+F3))
This formula siply decrease temparature of hot water and mixes hot and cold water.
Results
There are two sheets with results, both including graphs.
Averages_per_year
In this sheet you can find average values of temperature for every day and 10 minutes or hour during the year.

Statistics
Where you can find average, maximal and minimal temperature for every week.
Conclusion
As you can see from the model even quite high values of "Mean temp. decrease" and "Maximum percent deviation" values are unable to differ the temperature a lot. For set distributions temparature is betweeen 10 and 35 degrees with average about 18 degrees. I do not suppose that this an artefact of the model because it