Cartel simulation
Introduction
The leniency program of the European Commission offers the companies involved in a cartel either complete or partial immunity from fines if they self-report and hand over evidence. It was introduced in 1996, following the surge in amnesty applications in the wake of the 1993 revision of the Corporate Leniency Program of the US Department of Justice’s Antitrust Division. Reports from various implemented leniency programs showed that such programs led to numerous applications. However, despite the clear increase in leniency applications, the question poses itself as to whether the programs were also successful in a sense that the actual cartel rate in those countries declined. The simulation will be based on a study of Harrington and Chang from 2015, in which they concluded the following:
• The actual cartel rate decreases in case that the leniency program does not affect the non-leniency enforcement
• But: if the non-leniency enforcement is affected because resources are shifted to the prosecution of leniency application cases, there might be two possibilities, the cartel rate might increase.
This simulation focuses on the latter case. Assuming endogenized non-leniency enforcement, the introduction of a leniency program might have a differential impact on different industries. If a leniency program is introduced, the cartels that are about to collapse will seek to self-report. This in turn shifts resources from exposing active cartels to prosecuting cartels that are already collapsing. This creates more work for the authorities, who, instead of focusing on active cartels may now focus on dying cartels. This crowding-out effect coming about with the introduction of a leniency program shall be simulated in this project.
Goal
The simulation will have the following objectives:
- Illustrate the change in cartel rates and the change in the average life expectancy of a cartel triggered by the introduction of a leniency program in case of endogenized non-leniency enforcement for industries with unstable cartels (e.g. industries with a high number of competitors, or demand with more price elasticity) and for industries with stable cartels (e.g. industries with less competitors and demand with less price elasticity).
- Illustrate how many resources may be shifted from non-leniency enforcement to prosecuting leniency application cases without it having an undesired effect on the actual cartel rate.
Simulation and data
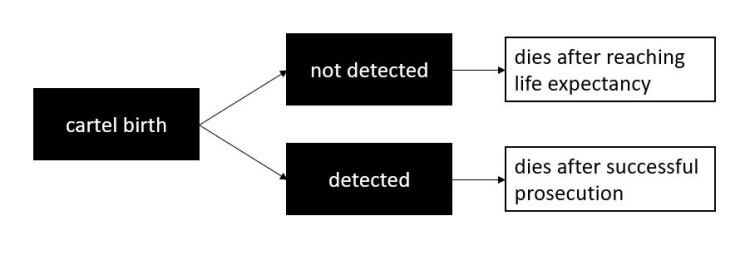
The dynamic that controls N(t), the number of cartels alive at time t, was first described by Bryant and Eckard (1991) using the concept of birth and death. I use this framework to model cartel detection as well. Contrary to these authors, I take into account three processes in the model that follows: (1) one that has to do with cartel formation, (2) another with their natural demise, and (3) a third that handles cartel detection. Some cartels are discovered while they are still in operation, and I hypothesize that this discovery causes the cartel to disband as a result of antitrust intervention. Ex post cartel detection, after a cartel has died, is not considered in this model. Cartel duration (life expectancy) is considered "natural".
The leniency program was introduced in 1996. I have selected all data from the EU commission from 1964 until 2010 (short preview below):
In total, there are 196 prosecuted cartel cases for those years. According to Combe at al. (2008), 12.9% to 13.3% of all the cartels are not detected. Using this in my calculation, this would result in an approximate average of 31 cartels per year for the complete period of time from 1964 to 2010. Now, splitting the data into the period from 1964 to 1996 (without leniency) and the period from 1996 to 2010 (with leniency), I get an approximate of 27 cartels per year before the introduction of leniency and 45 cartels per year after the introduction of leniency. This can be simplified and used for the simulation.
Model
I start with the general setup, where I create the following turtle breeds:
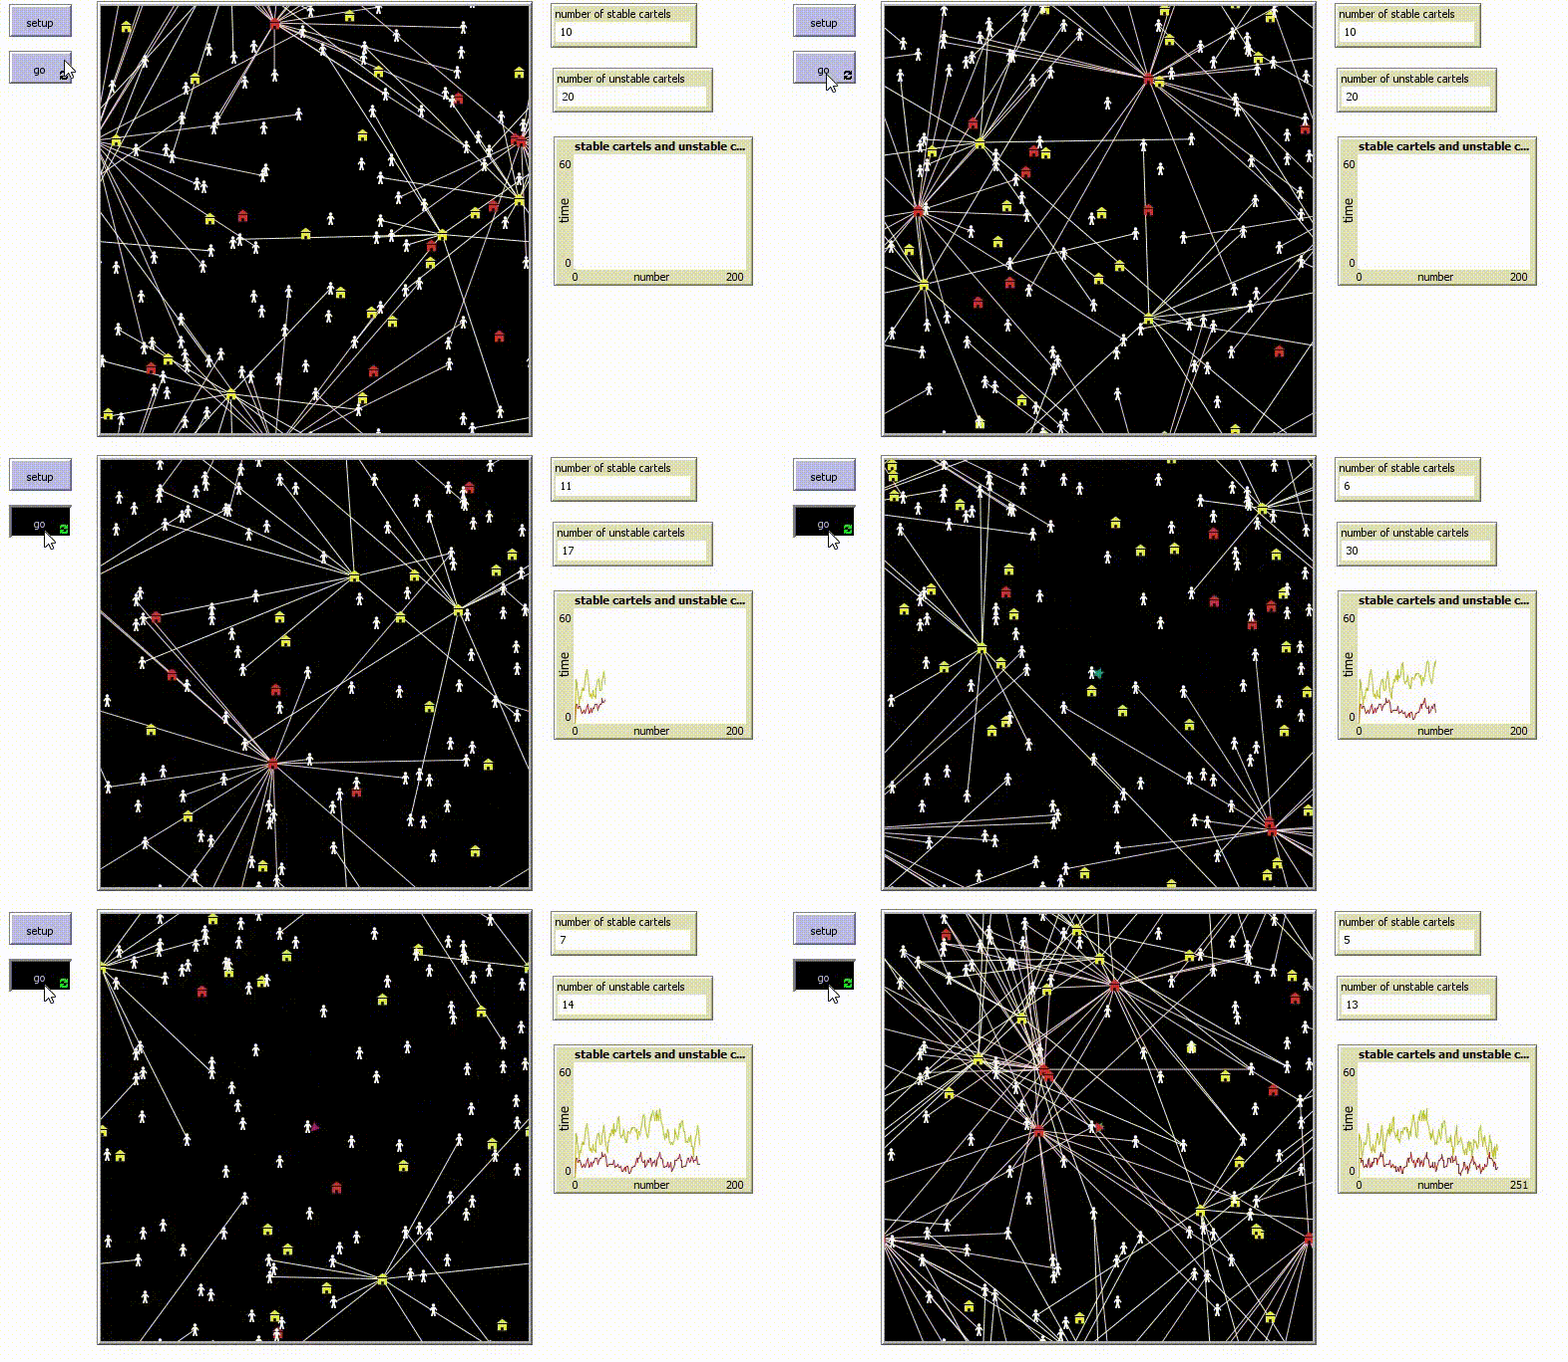
- enforcement-officials (white persons)
- stable-cartels (red houses)
- unstable-cartels (yellow houses)
The enforcement officials are together tackling some stable and some unstable cartels. To take down a stable cartel, it takes 4 years (= four ticks in NetLogo). To take down an unstable cartel, it only takes 2 years (= two ticks in NetLogo).
We can then see the birth, death, and prosecution pre leniency in the following simulation:
The number of all the cartels is constantly around the number of 27 cartels, on the left hand side there is a monitor showing how the number of the stable and the unstable cartels are changing over time.
Cartels do have an average life expectancy between 7.5 and 7.7 years according to Combe et al. (2008). Harrington and Chang (2015) explain that stable cartels in general have a higher life expectancy than unstable cartels. Thus, in my simulation, I have assigned a life duration of 6 to 11 years to stable cartels and 3 to 6 years to unstable cartels. This should more or less result in an average life expectany of 7.5 to 7.7 years for all the cartels taken together.
With leniency program
[add text here]
How to use the program
[add text]
Conclusion
[add text]
Code
[add text]


