Casual loop diagram
- The Essay topic: Casual loop diagram
- Class:4IT496 Simulation of Systems (WS 2014/2015)
- Author: Martina Nováková
Contents
Introduction
Everything is connected to everything else. It doesn´t matter if it is nature or human environment, there is a large and complex web of interactions. But sometimes we need only sections of these connections, and so we have to isolate issues which we would like to describe and observe. There are different word and arrow diagrams, e.g. causal-loop diagrams, cognitive maps or fishbone diagrams. They are widespread in system dynamics. This chapter is concentrated on issue of causal loop diagrams. (Haraldsson, 2000)
Description of causal loop diagrams
Causal loop diagrams (CLDs) are a very simple but powerful way of visualizing important parts of the system and how they interrelate. It is a great tool for dealing with complex problems and the striking component of system dynamics.
Causal loop diagrams are useful for displaying the behaviour of cause and effect from system standpoint. they show the interrelation between causes and their effects. They are quite popular because it is easy to start drawing these diagrams. All you need to draw CLDs is pencil and paper or a whiteboard. You can use software for drawing this type of diagram too. These possibilities will be introduced later.
As stated above there are other tools which are used for modelling of system dynamics. One of them which could seem the same as Casual loop diagram is a Fishbone diagram (or we can call it Cause and effect diagram). But this diagram is different because he can induce categories of causes that impact a problem. Although CLDs focuses on causation too, there are differences because CLDs are more general and more expressive than fishbone. (Osgood, 2004). After finishing this diagram there is diagram of the negative and positive reinforcements.
The main principle of the Causal loop diagram is quite simple. Parts of a system are visualized using textual identifies. The connections between the parts are shown using arrows pointing in the direction of influence. Creating the causal loop diagram with given system is actually quite simple. we start with the parts we already know and keep asking what influences this part has until we reach parts that are at the systems boundary. There are all parts that do not change. Then you go in the other direction and keep asking which other parts of the system influence this part If that part is already there you connect it otherwise you create a new part.
Symbols of CLDs
There will be explained main symbols of causal diagram loops and procedure of its creation. If we want to put system in practise, we have to follow some rules. There are several causal loop concepts. (Haraldsson, 2000)
The arrow is used to show causation. The item at the tail of the arrow influences the item at the head of the arrow.
The + sign near the arrowhead signifies that the item at the tail of the arrow and the item at the head of the arrow change in the same direction. If the tail increases, the head increases; if the tail decreases, the head decreases.
The – sign near the arrowhead indicates that the item at the tail of the arrow changes in the opposite direction. If the tail increases, the head decreases; if the tail decreases, the head increases.
The symbol B, which is in the middle of a loop, signifies that the loop moves away from equilibrium point. This loop continuous going in the same direct. This is called a positive feedback loop.
The symbol R, which is in the middle of a loop, signifies changing direction of the loop. It means that the system move toward equilibrium. This is called a negative feedback loop.
Types of loops
Because system always makes circular organization, it is forming feedback loops. In many cases changing one factor will impact another factor. This factor will again affect the first one. There are two main types of loops called positive and negative feedback loops. All loops will be explained with an example and there will be stated their dynamic behaviour.
Positive feedback loop
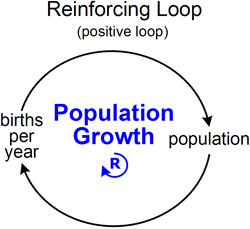
This loop is called a reinforcing loop too and leads to growth at an ever-increasing rate. It is called as exponential growth. The reinforcing loop is typical for population growth. When population goes up, births go up . As we can see on the picture a loop goes always round until there is a hit limit (but this is not shown). Another example of the positive feedback loop is a theatre trying to improve its profitability. If the theatre gives more investments in a production there could be better plays and more famous actors. There will be higher ticket sales (Mind Tools Ltd, 2014) (Harich, a další, 2014). 
Negative feedback loop
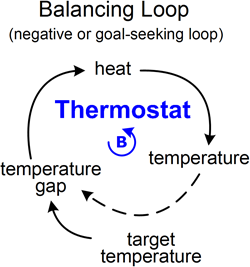
This loop is called a balancing or goal-seeking loop because it looks for a goal. It means if the actual state of the variable doesn’t reach the goal the loop structure pushes its value up. On the other side if the variable is above goal, it pushes it down. An example of this loop is a thermostat which you can see on picture 2. Another example is situation of under-resourced service company which wants to raise quality. Although better quality of services directs to improved customer satisfaction (and leads to an increase in demand), the company has not too much time for customers and this influences its ability to improve quality (Mind Tools Ltd, 2014) (Harich, a další, 2014).

Other cases of feedback loops
Other special cases of loops are negative feedback loops with delay and combination of positive and negative loops. Dynamic behaviour of negative feedback loops with delay can direct to oscillation. The amplitude of Oscillation can last indefinitely, or in the other example oscillation could gradually decrease. The amplitude of the oscillation decreases if the variable towards to the goal. An example of the gradually decreasing amplitude of oscillation is distribution systems (Kirkwood, 2013).
Positive and negative feedback loops usually don’t work distinctly. They can be combined. Dynamics behaviour of combination of positive and negative loops towards to different patterns. (Kirkwood, 2013). This is typical for biochemical switches. They have to work together cause they have to make special flexible system (Pfeuty B., Kaneko K. (2009). "The combination of positive and negative feedback loops confers exquisite flexibility to biochemical switches". Phys. Biol. 046013: 1–11.) On the picture we can see that at first there leads positive feedback loops. It towards to exponential growth.
Creating CLDs
This part is derived from (Kirkwood, 2013) and (American Creativity Association, 2014). There is no integrated process to drawing a causal loop diagram. But we can accept some reccomendation.
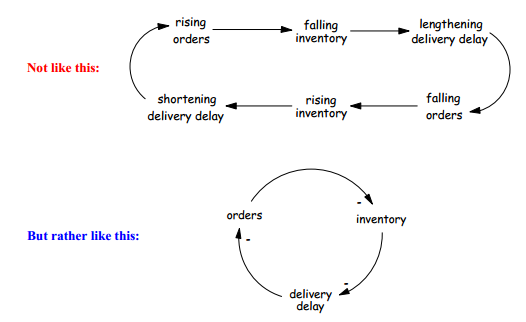
1) At first we have to start with the problem. We have to understand and define the problem which shall be solved. This is necessary to start with. We should ask what is wrong and what the root source of the problem is. When we want to find a cause ask why, to find effect ask what happens. We should use e.g. only orders, inventory and delivery delay instead of rising orders, falling orders, falling inventory and so on. This example youcansee on the picture below.
When we are thinking about elements of the causal loop diagram we should use nouns and noun phrases.
2) Describe relations between a cause and effects. Bear in mind constantly that + and – doesn’t mean bad or good. Plus is used for intensification and minus is used for diminishing effects. When we construct links, we should expect that there can be other possible unexpected sides. We should think about adding this links for representing side effects.
3) When we draw negative feedback, it is usually comprehensible if there is existing gap which directs toward the goal.
4) In many examples we can accept that there is delay when the actual state is perceived. For this situation it could be important if we include the causal loop diagram for the actual value and the perceived value.
5) In many causal loop diagrams there is no difference between long and short result or process. And this is not so right, because you should make difference between these two states.
6) If you think that the links between two elements are hard to say in a simple way, you should use more simple intermediate elements.
7) For someone who is reading your diagram is necessary to have it in a simple form. There hasn’t be illustrated every detail.
CLDs in practise and their problems
CLDs in practise
We can ask how the causal loop diagram is useful in practise. If we develop it and present it carefully, it can be very useful for us. We can find very successful CLDs in practise. The most popular example is CLDs of population growth (it could be people or animals or both, that doesn’t matter) and resources diagrams. In the population growth diagram we can control how Immigration and the Birth and death rate change over time. There could be a more extensive demographic example with different age groups and other factors (Halbleib, 2014).
But there are other examples of great using of CLDs. CLDs can be useful in causal modelling to understand organizations and businesses. This is trend in the recent years. CLDs are used in business prototyping, where we can model productivity and causes which influence it, e.g. remaining time, schedule pressure, deadline and so on. This casual loop diagram can be seen on picture. (Transentis Consulting, 2014).
Other examples of Causal loop diagrams are in medicine, biology or environment. We can demonstrate it on the causal loop diagram of the dynamics of diabetes. The picture and detailed description you can see in (Fonseca i Casas, 2014) or global warming system. There is a possibility to describe cases and effects of fish pond ecosystem by CLDs. PA Consulting Group created CLDs called “Afghanistan Stability / COIN Dynamics“. It is really extensive diagram summarized a snapshot of U.S. military´s plan (PA Consulting Group, 2010).
Problem of CLDs
For many types of examples it is clearer to use a hybrid diagram which contains stock-flow chain. But this could be harder for visual language. There are many problems with notation too. There is not uniform labelling. Sometimes it is used an “s” (means “same”) and “o” (means “opposite”) instead of the + and -. This problem is explained by George Richardson in his paper “Problems with casual loop diagrams” and his conclusion is that it is not good to use “s” and “o” because it is less confusing. (Richardson, 1986) .
Tasks
Questions Try to illustrated causal loop diagram in the picture dealing with zebras and lions. File:Q1 Try to draw your own causal loop diagram which is contained from demand, profits, price, market expecations and other. Answers Answer for question number 1. File:A1 Answer for question number 2. File:A2
[=References= American Creativity Association. 2014. Causal loop diagram. American Creativity Association. [Online] 2014. [Cited: 27 December 2014.] http://www.amcreativityassoc.org/Resources/Documents/CausalLoopDiagrams.pdf.
Fonseca i Casas, Pau. 2014. Formal Language for Computer Simulation:Transdisciplinary Models and Applica\\Ction. Hershey : IGI Global, 2014. 978-1-4666-4370-3.
Halbleib, Harold. 2014. System Models & Simulation. http://www.projectperfect.com.au/. [Online] 7 November 2014. [Cited: 30 December 2014.] http://www.projectperfect.com.au/info_system_models_and_simulation.php.
Haraldsson, Hördur V. 2000. Introduction to Systems and Causal Loop Diagrams. Lunds Universitet. [Online] January 2000. [Cited: 30. December 2014.] http://cmap.crs.org.pl:4444/rid=1244140954250_1167059429_1461/Introduction%20to%20Systems%20and%20Causal%20Loop%20Diagrams.pdf.
Harich, Jack and Bangerter, Philip. 2014. Feedback Loop. http://www.thwink.org/. [Online] 2014. [Cited: 29 December 2014.] http://www.thwink.org/sustain/glossary/FeedbackLoop.htm.
Kirkwood, Craig W. 2013. System behaviour and causal loop diagram. Arizona State University. [Online] 12 January 2013. [Cited: 28 December 2014.] http://www.public.asu.edu/~kirkwood/sysdyn/SDIntro/ch-1.pdf.
Mind Tools Ltd. 2014. Systems Diagrams - Understanding How Factors Affect One Another. http://www.mindtools.com/. [Online] 2014. [Cited: 29 December 2014.] http://www.mindtools.com/pages/article/newTMC_04.htm.
Osgood, Nathaniel. 2004. Problem Diagnosis & Introduction to Project Dynamics. http://ocw.mit.edu/index.htm. [Online] 13 April 2004. [Cited: 28 December 2014.] http://ocw.mit.edu/courses/civil-and-environmental-engineering/1-040-project-management-spring-2004/lecture-notes/l16diagnsprjctrl.pdf.
PA Consulting Group. 2010. Afganistan Dynamic Planning. MSNBC media. [Online] 2010. [Cited: 28 December 2014.] http://msnbcmedia.msn.com/i/MSNBC/Components/Photo/_new/Afghanistan_Dynamic_Planning.pdf..
Richardson, George P. 1986. Problems with causal-loop diagrams. System thinking. [Online] 1986. [Cited: 29 December 2014.] http://www.systems-thinking.org/intst/d-3312.pdf.
Transentis Consulting. 2014. Causal Loop Diagrams. Business prototyping blog. [Online] 2014. [Cited: 30 December 2014.] http://www.business-prototyping.com/step-by-step-tutorials/. ]

