Difference between revisions of "Pension System Czech Republic"
(→Code) |
|||
| Line 305: | Line 305: | ||
| − | + | [[User:Omaj01|Omaj01]] ([[User talk:Omaj01|talk]]) 20:54, 9 January 2025 (CET) | |
| − | [[User:Omaj01|Omaj01]] ([[User talk:Omaj01|talk]]) 20: | ||
Latest revision as of 20:54, 9 January 2025
Contents
Introduction
Simulation of pension reform in the Czech Republic: Analysis of long-term sustainability
What will be simulated:
A system dynamics model of the Czech pension system that simulates the long-term financial sustainability under varying demographic, economic, and policy scenarios. The simulation will project future balances of the pension system, incorporating the flows of revenues (social insurance contributions) and expenditures (pension payouts)
Problem definition
The main goal is to analyze how different pension reform strategies (e.g., adjusting retirement age, altering contribution rates, changing the indexation formula of pensions) will affect the long-term stability of the Czech pension system. The simulation aims to identify specific policy levers and thresholds that ensure the pension system’s financial equilibrium over a multi-decade horizon, despite changing demographic and economic conditions.
Method
The System Dynamics method was chosen for its ability to model complex systems with multiple influencing variables, inflows, and outflows. Alternative approaches, such as Monte Carlo analysis or agent-based modeling in NetLogo, were deemed unsuitable for this case as they cannot adequately capture the dynamic interactions and feedback loops between demographic, economic, and policy variables. Vensim PLE was selected as the simulation environment due to its accessibility and support for this type of modeling.
Model
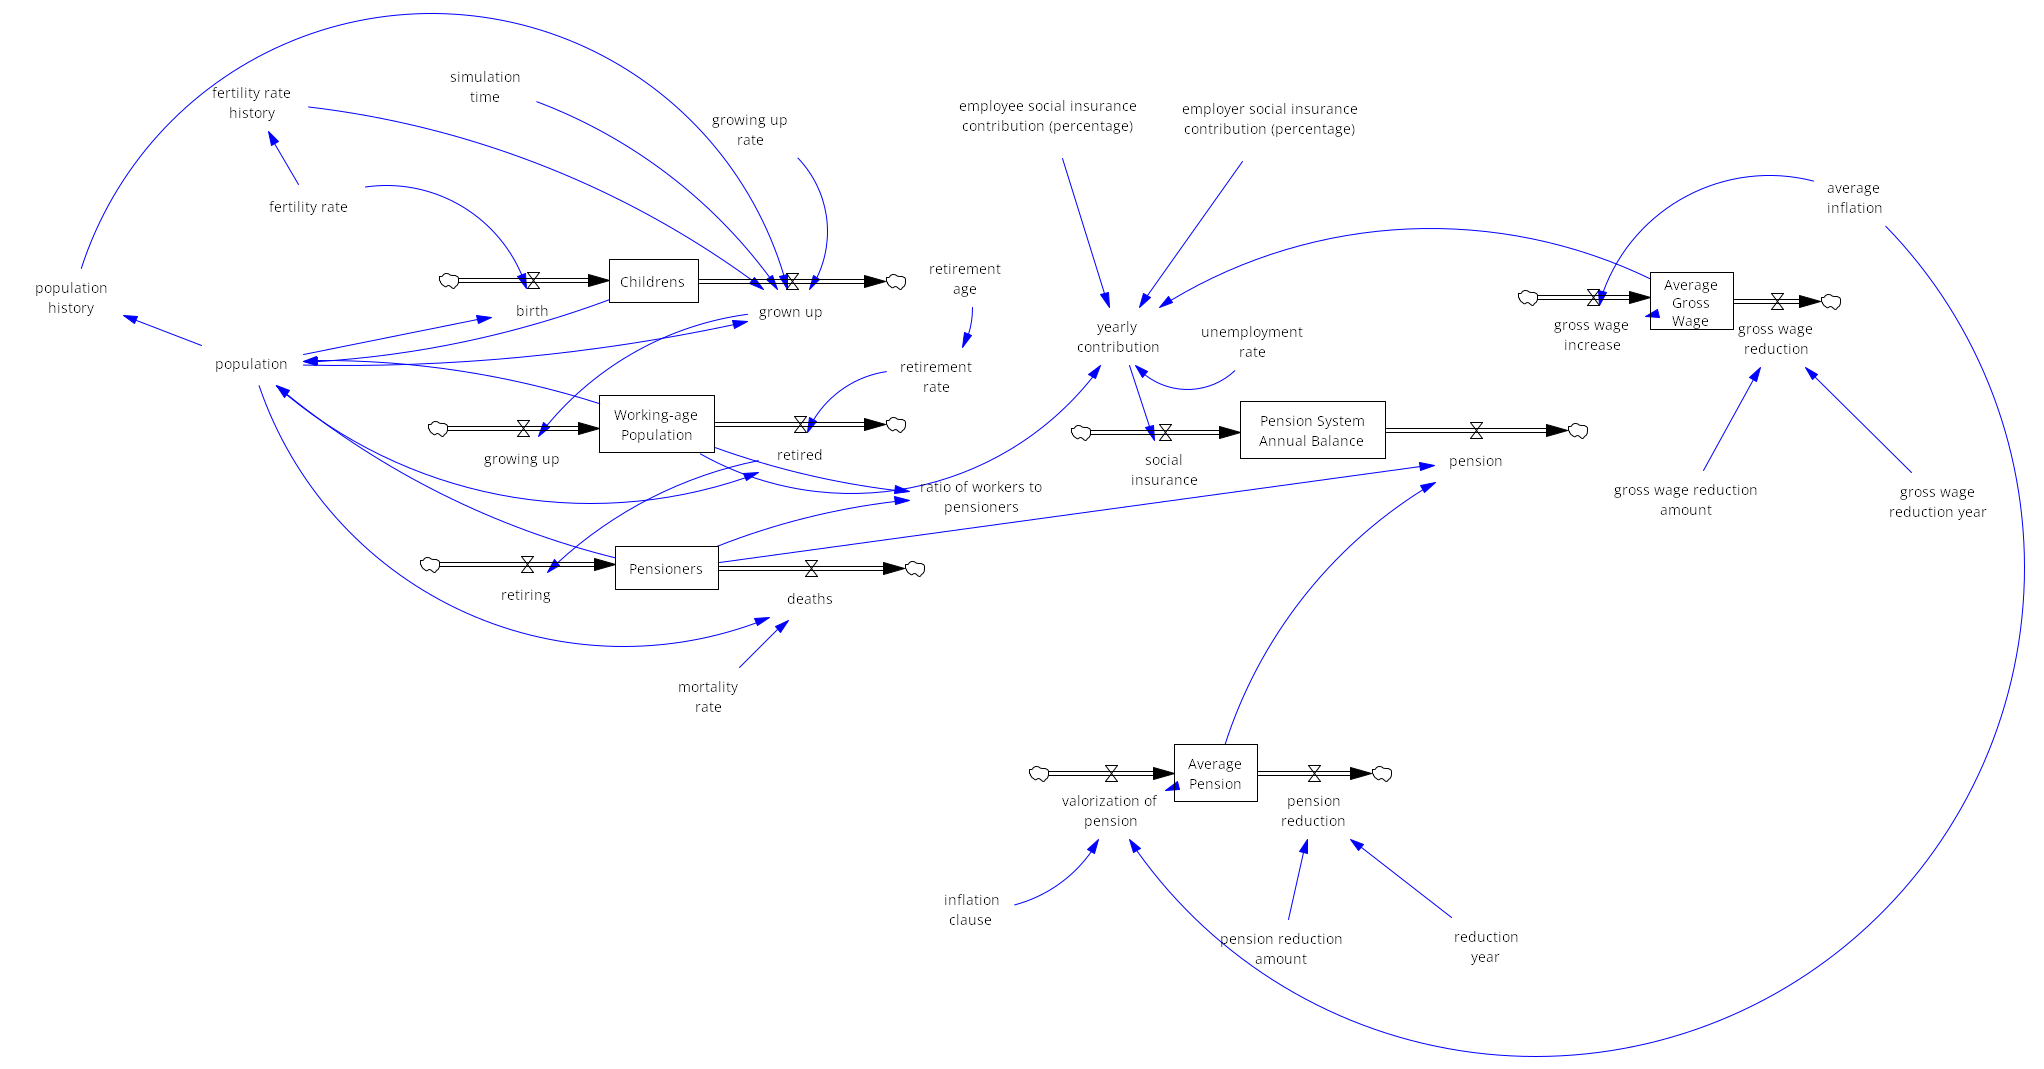
The model represents the dynamics of the Czech pension system, divided into key components: population structure, contributions to the pension system, and pension expenditures.
Population structure
The population is categorized into children (ages 0–19), working-age population (ages 20–64), and pensioners (65+ years). Children grow up and transition into the working-age population, which contributes to the pension system through employment. Over time, individuals retire and become pensioners, withdrawing from the pension system. The retirement age determines the rate at which the working-age population transitions to retirement, with a higher retirement age reducing the retirement rate and vice versa.
Contribution to the pension system
The working-age population contributes to the system through social insurance contributions, based on the average gross wage. Contributions come from both employees and employers, while unemployment reduces the total contributions collected. The model assumes that the gross wage grows annually, at least partially indexed to inflation (e.g., one-third of the inflation rate).
Pension expenditures
Pensioners withdraw funds from the system based on the average pension, which is periodically adjusted through pension valorization. The inflation clause determines the extent to which pensions are indexed to inflation, ensuring their real value remains stable over time.
External adjustments
The model includes variables for one time reductions in both the average gross wage and the average pension in a specific year. These adjustments simulate policy interventions (e.g., government mandated pension reductions) or external shocks (e.g., an economic crisis) that impact wages or pensions.
This dynamic interaction between population groups, contribution flows, and pension expenditures allows for the simulation of various policy scenarios, illustrating the long-term sustainability of the pension system.
Variables
Population variables
- Childrens: Represents the population aged 0-19 and serves as new entrants to the future workforce.
- birth: Represents the number of children entering the stock of "Children" annually, driven by the fertility rate.
- grown up: Represents the transition of individuals from "Children" to "Working-age Population," determined by the growing up rate (later the figure reflects the number of births before 20 years).
- Working-age Population: Population aged 20-64, representing workers contributing to the pension system.
- growing up: Transition from "Children" stock into "Working-age Population."
- retired: Represents the number of individuals leaving the working-age population to become pensioners, driven by the retirement rate.
- Pensioners: Population aged 65 and above, representing beneficiaries of the pension system.
- retiring: Transition of individuals from "Working-age Population" to "Pensioners."
- deaths: Represents the number of pensioners leaving the stock due to mortality, driven by the mortality rate.
Policy variables
- retirement age: Defines the age at which individuals become eligible for a pension. Higher retirement age reduces the retirement rate, delaying transitions into the pensioner stock and vice versa.
- employee social insurance contribution (percentage): The percentage of an employee’s wage contributed to the pension system
- employer social insurance contribution (percentage): This is the percentage paid by the employer on behalf of their employee into the pension system.
- inflation clause: A mechanism that adjusts pensions annually based on inflation, specifying not just whether adjustments occur, but also to what extent (e.g., full inflation, partial indexing like 50%, or less).
Economic variables
- Average Gross Wage: Represents the average income of workers, directly impacting total contributions to the pension system.
- gross wage increase: Represents annual growth in average wages due to economic factors like inflation.
- gross wage reduction: Represents potential reductions in wages caused by economic crises or policy changes.
- Average Pension: It represents the average pension paid to pensioners.
- valorization of pension: Reflects annual adjustments to pensions, linked to inflation and indexation mechanisms (valorization).
- pension reduction: One time reduction in the average pension amount, simulating government mandated adjustments.
Fiscal variables
- Pension System Annual Balance: Tracks the annual difference between contributions collected and pensions paid, indicating the system's financial health.
- social insurance: Total contributions collected driven by yearly contribution.
- pension: Total annual expenditure on pensions, calculated as the product of the number of pensioners and the average pension.
- yearly contribution: Total revenue collected from working-age population contributions, influenced by unemployment rate, average gross wage, and contribution percentages.
- unemployment rate: The proportion of the working-age population that is unemployed, reducing total contributions.
Random variables
- fertility rate: Reflects the probabilistic distribution based on historical data and birth predictions, providing insights into future workforce size and population growth..
- mortality rate: Mortality rate reflects the probabilistic distribution based on historical data and mortality predictions, providing insights into life expectancy and death rates, which influence population transitions and pension payouts.
- average inflation: Reflects a probabilistic function derived from the median of historical inflation data, capturing economic variability through stochastic projections.
- retirement rate: It corresponds to the variability in the number of people retiring each year.
- growing up rate: Simulates the transition of children (aged 0-19) into the working-age population, based on fertility patterns for the first 20 years and precise simulation data thereafter.
Auxiliary variables
- fertility rate history: Stores historical fertility rates to project future workforce accurately after 20 years.
- population history: Tracks past population levels for precise calculations in future aging.
- simulation time: Tracks the current simulation cycle for transitioning between estimated and precise aging.
- population: Represents the total population at any simulation step, serving as the sum of all age groups.
Economic adjustment variables
- gross wage reduction amount: Simulates reductions in the average wage due to policy or economic crises.
- gross wage reduction year: Specifies the year when a reduction in average wages occurs.
- pension reduction amount: Simulates government measures to reduce pensions, implemented as part of necessary fiscal adjustments.
- reduction year: Identifies the year when a pension reduction is implemented.
'Variables for measurable metrics
- ratio of workers to pensioners: A key metric representing the dependency ratio, calculated as the number of working-age individuals per pensioner.
Variables Data
Population variables
- Childrens (Number of children at start (2021 - census)):
- children age = 0 – 19
- number of children = 2,181,596
- Working-age Population (Number of working-age population at start (2021 - census)):
- working-age population = 20 – 64
- number of working-age = 6,194,523
- Pensioners (Number of pensioners at start (2021 - census)):
- pension age = 65
- number of pensioners = 2,148,048
Policy variables
- retirement age = 65
- employee social insurance contribution (percentage) (2021) = 6,5%
- employer social insurance contribution (percentage) (2021) = 25%
- inflation clause:
- inflation clause starting point = yes
Economic variables
- Average Gross Wage:
- average wage starting point 2021 = 37 839 Kč
- Average Pension:
- average pension starting point 2021 = 15 425 Kč/month
Fiscal variables
- unemployment rate:
- average unemployment = 5.44% (1993 – 2023)
Random variables To incorporate a realistic level of variability into the population model, stochastic behavior was added to five key rates: fertility, mortality, growing up,retirement and average inflation. Instead of treating these rates as fixed constants, their values are drawn from probability distributions during each simulation run (or time step), based on historical averages and standard deviations.
- fertility rate:
- fertility average: 0.89%
- fertility standard deviation: 9.584343067×10^(-4)
- mortality rate:
- mortality average: 0.65%
- mortality standard deviation: 3.014130177×10^(-3)
- retirement rate:
- retirement average: 1.26%
- retirement standard deviation: 1.684852281×10^(-3)
- growing up rate:
- This variable simulates the transition of children into the working-age population at age 20. For the first 20 years, it mirrors the fertility rate, assuming minimal mortality. After 20 years, the model transitions to using the exact number of births from prior simulated years to determine the number of adults entering the workforce.
- average inflation:
- median inflation: 2.50%
- standard deviation: 0.035619722281127
- Due to significant fluctuations in historical inflation data, including extreme values (e.g., 15.1% in 2022), the median was chosen over the mean to reduce the impact of outliers.
Variables Vensim
Stock
- Childrens = INTEG ( birth - grown up, 2.1816e+06 )
- Working-age Population = INTEG ( growing up - retired, 6.19452e+06 )
- Pensioners = INTEG (retiring - deaths, 2.14805e+06 )
- Average Gross Wage = INTEG ( gross wage increase - gross wage reduction, 37839 )
- Average Pension = INTEG ( valorization of pension - pension reduction, 15425)
- Pension System Annual Balance = ( social insurance – pension, 1 )
Variables
- birth = population*fertility rate
- grown up = IF THEN ELSE(simulation time >= 20, fertility rate history * population history, population * growing up rate)
- growing up = grown up
- retired = population*retirement rate
- retiring = retired
- deaths = population*mortality rate
- retirement age = 65
- employee social insurance contribution (percentage) = 0.065
- employer social insurance contribution (percentage) = 0.25
- inflation clause = 0.5
- gross wage increase = Average Gross Wage * 0.3 * average inflation
- gross wage reduction = PULSE( gross wage reduction year, 1) * gross wage reduction amount
- valorization of pension = Average Pension * inflation clause * average inflation
- pension reduction = PULSE( reduction year , 1 ) * pension reduction amount
- social insurance = yearly contribution
- pension = Pensioners * Average Pension
- yearly contribution = ("Working-age Population" * (1 - unemployment rate)) * Average Gross Wage * ("employee social insurance contribution (percentage)" + "employer social insurance contribution (percentage)")
- unemployment rate = 0.0544
- fertility rate = RANDOM NORMAL(0, 0.05, 0.0089, 0.000958434, 888)
- mortality rate = RANDOM NORMAL(0, 0.05, 0.0065, 0.00301413, 999)
- average inflation = RANDOM NORMAL(0, 0.15, 0.025, 0.0356197, 999)
- retirement rate = RANDOM NORMAL(0, 0.03, 0.0126, 0.00168485, 999) * (IF THEN ELSE( retirement age > 65, 1 -0.004 * (retirement age - 65), IF THEN ELSE( retirement age < 65, 1 + 0.004 * (65 - retirement age), 1)))
- growing up rate = RANDOM NORMAL(0, 0.05, 0.0089, 0.000958434, 888)
- fertility rate history = DELAY FIXED(fertility rate, 19, 0)
- population history = DELAY FIXED(population, 19, 0)
- simulation time = INTEG (1, 1)
- population = Childrens+Pensioners+"Working-age Population"
- gross wage reduction amount = 0
- gross wage reduction year = 1
- pension reduction amount = 0
- reduction year = 1
- ratio of workers to pensioners = "Working-age Population"/Pensioners
Results
After building and validating the system dynamics model, a series of simulation runs were performed with different parameter settings to explore the long‐term viability of the Czech pension system. The central metric examined in each run is the Pension System Annual Balance (total contributions minus total expenditures) and whether it remains positive or becomes negative within the 50‐year simulation horizon. Additionally, the ratio of workers to pensioners (i.e., “dependency ratio”) provides crucial insight into demographic shifts driving the sustainability or insolvency of the pension system.
Run 1
Parameters
- all default
Result
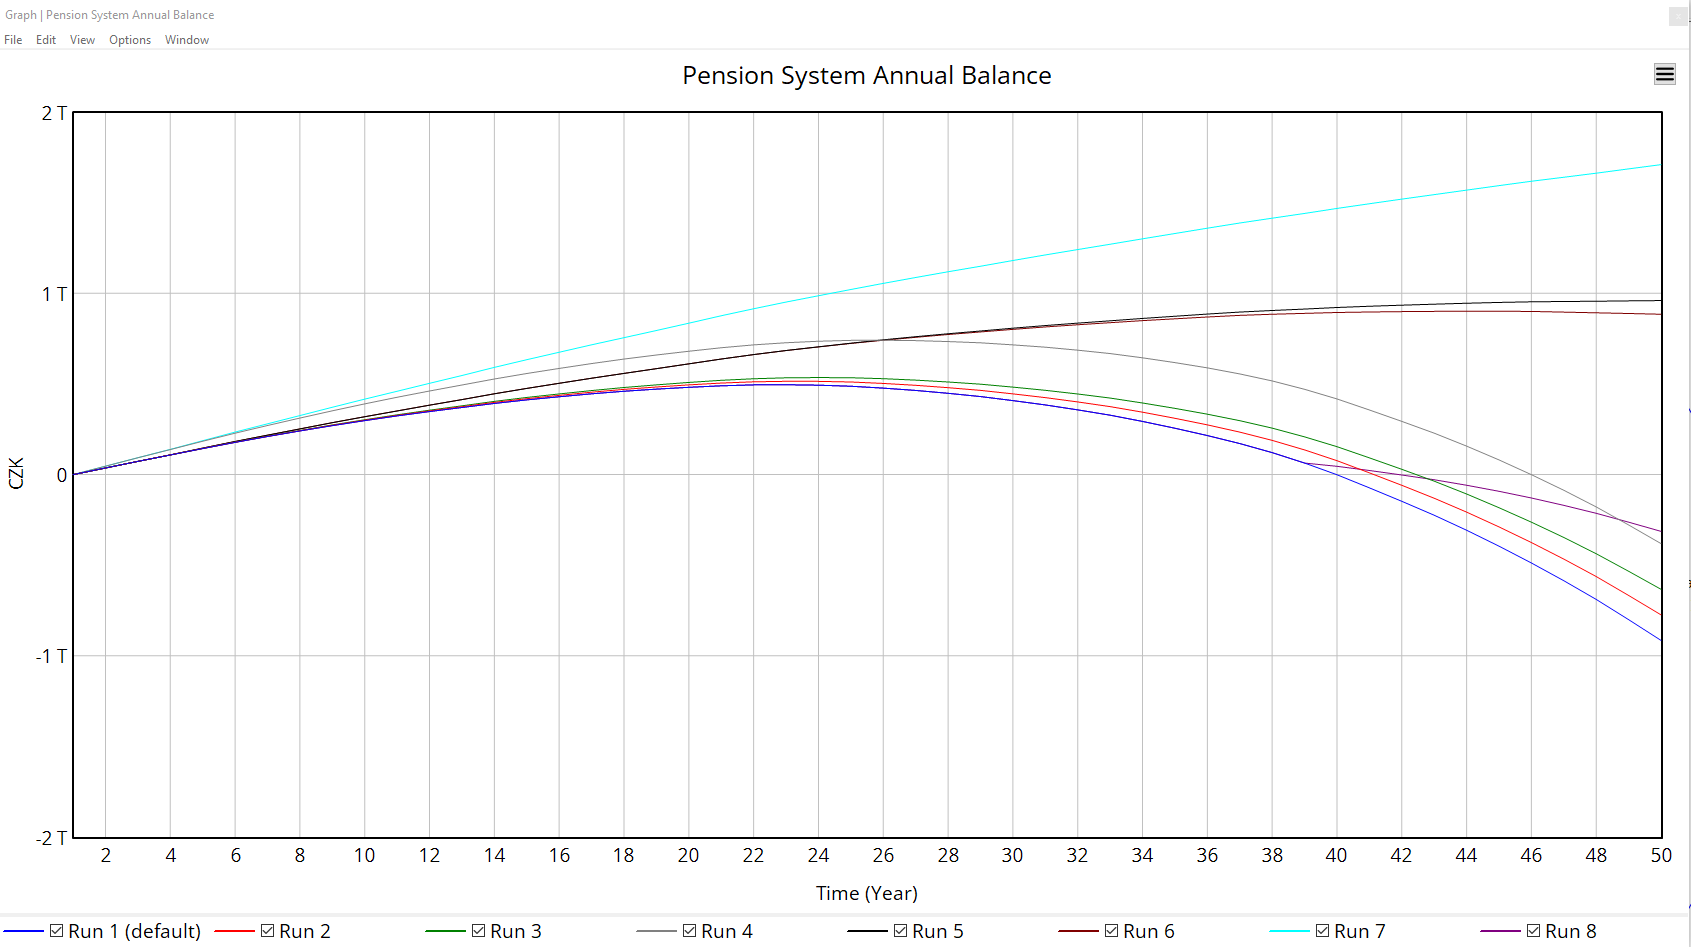
- Pension system went to negative numbers in year: 40
- Under default conditions, the combination of moderate valorization, standard contribution rates and a retirement age of 65 leads to a stable system only up to around Year 40. Afterward, expenditures outpace contributions as the ratio of workers to pensioners continues to decline.
Run 2
Parameters
- retirement age = 70
Result
- Pension system went to negative numbers in year: 42
- Increasing the retirement age to 70 postpones the shortfall by about two years compared to Run 1. Delaying retirement helps keep more people in the workforce for longer, temporarily improving the annual balance. However, the fundamental demographic trend still causes a deficit to appear eventually.
Run 3
Parameters
- retirement age = 75
Result
- Pension system went to negative numbers in year: 43
- Raising the retirement age further to 75 yields a modest extension of the system’s solvency (one more year than Run 2). This underscores that only adjusting the retirement age is insufficient; while it defers insolvency, the same demographic pressures ultimately bring the system into the red.
Run 4
Parameters
- employee social insurance contribution (percentage) = 0.08 (8%)
- employer social insurance contribution (percentage) = 0.28 (28%)
Result
- Pension system went to negative numbers in year: 46
- Increasing both employee and employer social insurance contributions significantly boosts near term revenue, extending solvency to Year 46. Even though higher contributions delay the shortfall longer than merely raising the retirement age (compare with Runs 2 and 3), the system still fails before the 50‐year mark under demographic pressure.
Run 5
Parameters
- inflation clause = 0 (without valorization / pension freeze)
Result
- Pension system went to negative numbers in year: N/A
- Freezing pension valorization temporarily stabilizes the system. However, as the ratio of workers to pensioners continues to decline, the growth of the pension fund slows down significantly. Eventually, the system would collapse as pension expenditures surpass contributions.
Run 6
Parameters
- inflation clause = 0.1 (10% valorization)
- retirement age = 75
Result
- Pension system went to negative numbers in year: N/A
- Combining partial valorization with a high retirement age postpones the system's collapse but does not eliminate it. The reduced pace of balance growth indicates that the system remains vulnerable to long-term demographic pressures.
Run 7
Parameters
- inflation clause = 0 (without valorization / pension freeze)
- employee social insurance contribution (percentage) = 0.08 (8%)
- employer social insurance contribution (percentage) = 0.28 (28%)
- retirement age = 75
Result
- Pension system went to negative numbers in year: N/A
- This is the most extreme scenario tested: no valorization combined with substantially higher contribution rates and a late retirement age. Financially, it defers or prevents a deficit in the 50‐year window, but the feasibility is highly questionable. Pensions do not keep pace with inflation, and contribution rates plus late retirement could be socially or politically unpalatable. Even here, if the worker‐to‐pensioner ratio continues declining beyond 50 years, the system might still face challenges in the very long term.
Run 8
Parameters
- pension reduction amount = 10 000
- reduction year = 40
Result
- Pension system went to negative numbers in year: 42
- A single large pension cut in Year 40 delays the shortfall by reducing total expenditures sharply in that year, but the system still becomes negative just two years later (Year 42). This indicates that a single policy shock (pension cut) can postpone deficits, yet does not provide a lasting solution. This highlights the inefficacy of short term interventions in addressing the structural issues of the pension system.
Run Graphs
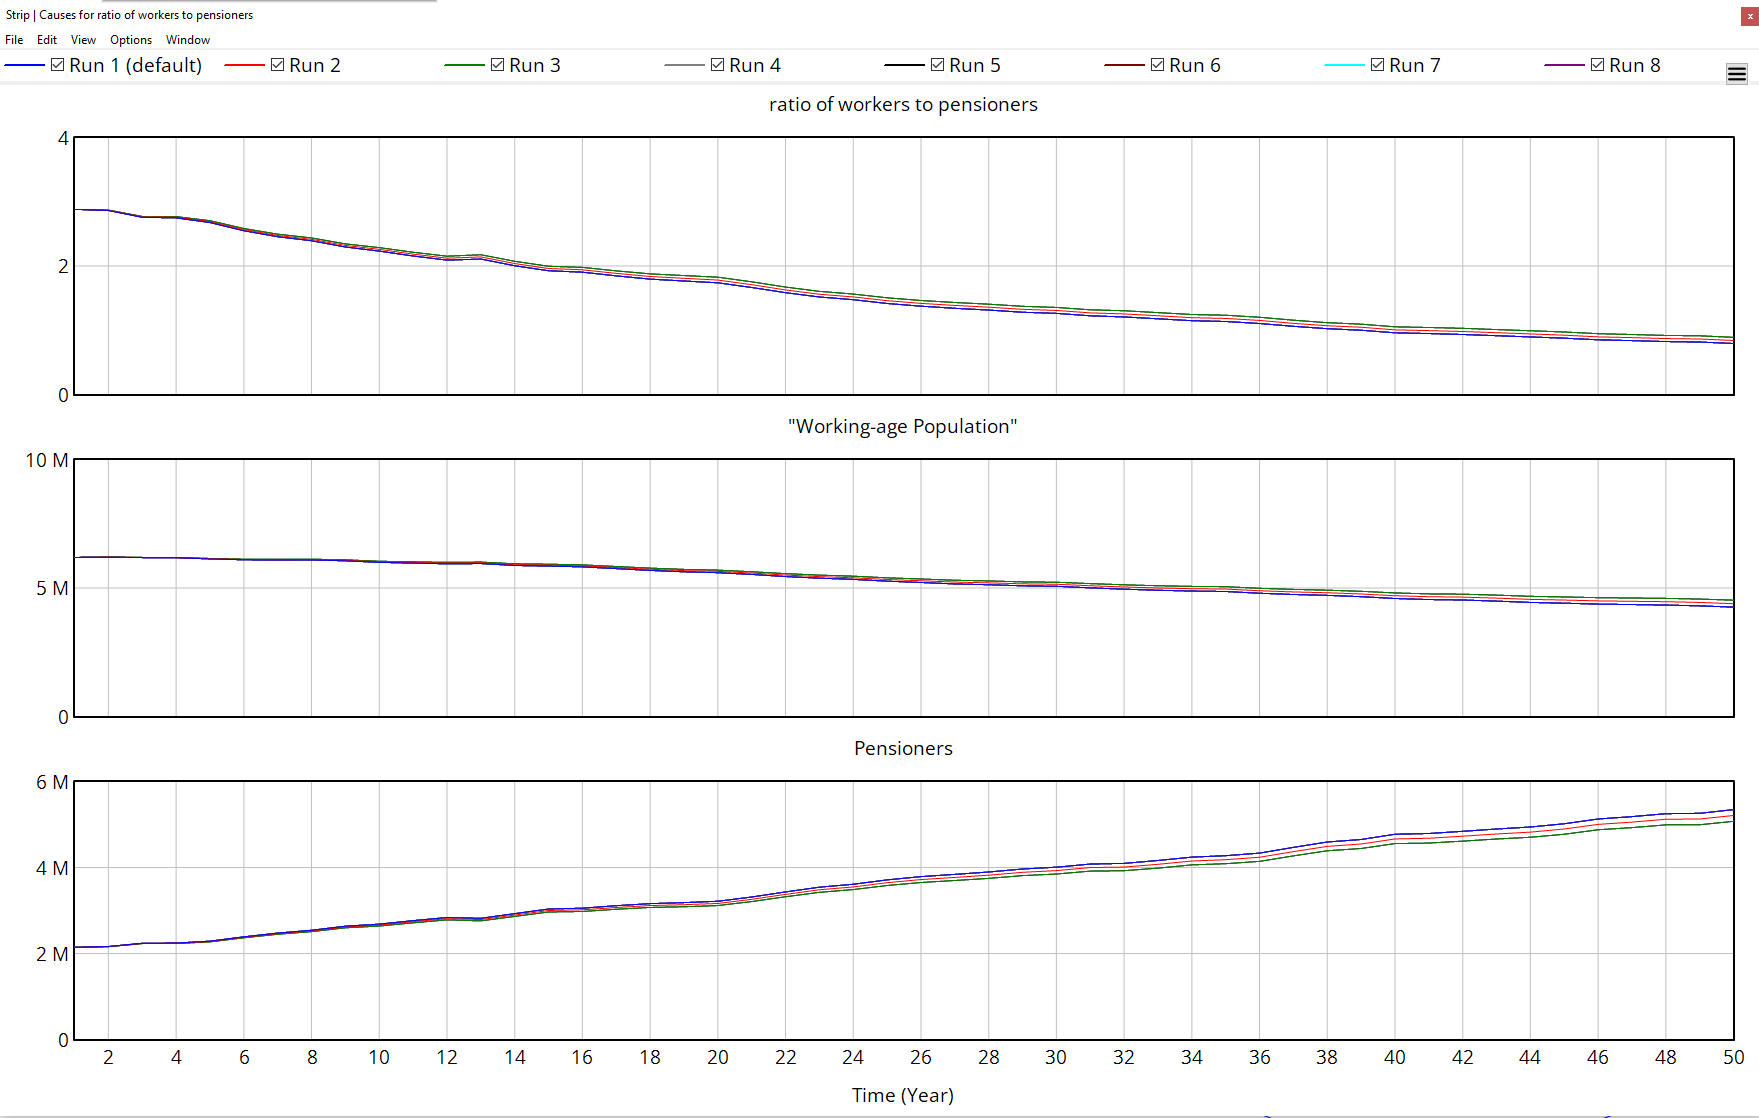
- All runs show a declining ratio over time. In every scenario, the model projects that eventually there will be fewer than one working age individual for each pensioner. This indicates strong demographic pressure on the system.
- The working age population generally decreases over the 50‐year horizon, though at slightly different rates depending on parameter adjustments (retirement age).
- The stock of pensioners tends to increase. Raising the retirement age only partially slows the growth of the pensioner population.
- Pension System Annual Balance shows how each scenario’s balance changes over time. Some reforms defer the point of insolvency by maintaining a surplus for a longer period (e.g., higher contributions, delayed retirement age, suspended pension indexation). However, all runs trend downward toward deficits once the ratio of workers to pensioners grows too unfavorable.
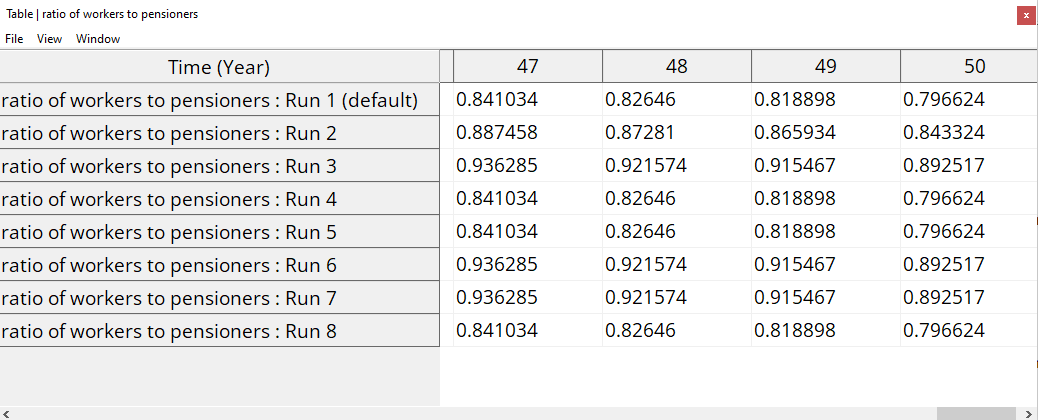
- Table shows that all simulations end with a worker to pensioner ratio below 1, indicating that the working age population cannot sustain the growing number of pensioners over the long term.
Summary
Overall, even though certain parameter changes can postpone or temporarily avoid a negative annual balance, the underlying demographic shift (a dwindling base of workers relative to a growing population of pensioners) persists. Over a sufficiently long time horizon, most scenarios still drift into insolvency once expenditures inevitably outstrip contributions.
Key findings
- Increasing the retirement age postpones failure but does not resolve the core issue.
- Reducing or freezing pension valorization provides temporary relief but fails to address the underlying demographic trends.
- While raising contributions extends the system's lifespan, it risks overburdening workers and employers, potentially harming economic growth.
- In every scenario, the ratio trends below 1.0 before or by the end of the 50‐year horizon. This indicates that fewer than one active worker exists for each pensioner, undermining the pay‐as‐you‐go nature of the system.
- Some measures will delay the deficit (e.g. raising the retirement age, increasing contributions, freezing or limiting pension growth), but none of them will actually prevent the ultimate collapse as the ratio of workers to pensioners continues to fall.
Conclusion
This set of simulations confirms that the current pay as you go pension framework in the Czech Republic is highly sensitive to demographic trends particularly the aging population and declining worker to pensioner ratio. No single “simple fix” (such as retirement age increase, increasing contribution rates, or pension freezes) fully addresses the system’s long term imbalance. Although such policy adjustments can postpone the point of insolvency, they do not eliminate the underlying pressures that will ultimately endanger the financial viability of the system.
Simulation results confirm the findings of previous and current Czech governments that have already attempted pension reforms, while underscoring the need for a complete transformation of the system. Without decisive, multifaceted action addressing demographic, economic, and fiscal factors, the pension system will remain unsustainable. Safeguarding future retirees thus requires fundamentally rethinking and restructuring the pension framework to accommodate ongoing demographic shifts.
Code
Media:PensionReform.mdl Media:SimulationRuns.zip
Media:WorkProcess.odt Media:DataPreparation.xlsx
Media:PensionReformAll.zip (all materials)
Sources
- E15. Odchod do důchodu v roce 2022: Kdy do něj mohou odejít muži a ženy a jak na výpočet [online]. E15, [cit. 2025-01-09]. Dostupné z: https://www.e15.cz/finexpert/vydelavame/odchod-do-duchodu-v-roce-2022-kdy-do-nej-mohou-odejit-muzi-a-zeny-a-jak-na-vypocet-1386333
- Český statistický úřad. Zaměstnanost - míra zaměstnanosti, míra nezaměstnanosti, ekonomická aktivita - podle pohlaví a věku (15-64 let) [online]. [cit. 2025-01-09]. Dostupné z: https://vdb.czso.cz/vdbvo2/faces/cs/index.jsf?page=vystup-objekt&z=T&f=TABULKA&pvo=ZAM06&katalog=30853&str=v95#w=
- Český statistický úřad. Projekce obyvatelstva České republiky 2023–2100 [online]. [cit. 2025-01-09]. Dostupné z: https://csu.gov.cz/produkty/projekce-obyvatelstva-ceske-republiky-2023-2100
- Eurostat. Population projections (proj_23np) [online]. [cit. 2025-01-09]. Dostupné z: https://ec.europa.eu/eurostat/databrowser/view/proj_23np__custom_14811061/default/table?lang=en
- Eurostat. Population projections by age, sex, and fertility rates (proj_23naasfr) [online]. [cit. 2025-01-09]. Dostupné z: https://ec.europa.eu/eurostat/databrowser/view/proj_23naasfr__custom_14811129/default/table?lang=en
- Eurostat. Mortality projections (proj_23naasmr) [online]. [cit. 2025-01-09]. Dostupné z: https://ec.europa.eu/eurostat/databrowser/view/proj_23naasmr/default/table?lang=en&category=proj.proj_23n
- Kurzy.cz. Hodnoty důchodů v roce 2021 [online]. [cit. 2025-01-09]. Dostupné z: https://www.kurzy.cz/hodnoty/duchod/2021/
- Ministerstvo práce a sociálních věcí ČR. Sociální pojištění v roce 2021 [online]. [cit. 2025-01-09]. Dostupné z: https://www.mpsv.cz/socialni-pojisteni-v-roce-2021
- Český statistický úřad. Průměrné mzdy – 4. čtvrtletí 2021 [online]. [cit. 2025-01-09]. Dostupné z: https://csu.gov.cz/rychle-informace/prumerne-mzdy-4-ctvrtleti-2021
- Český statistický úřad. Průměrná roční míra inflace v letech 1998–2022 [online]. [cit. 2025-01-09]. Dostupné z: https://csu.gov.cz/prumerna-rocni-mira-inflace-v-letech-1998-2022


