Difference between revisions of "D1 Highway Traffic simulation"
| Line 59: | Line 59: | ||
[[Media:D1Highway_xvitj27.nlogo]] | [[Media:D1Highway_xvitj27.nlogo]] | ||
| + | |||
| + | =Sources= | ||
| + | |||
| + | http://www.ceskedalnice.cz/prilohy/intenzity-2012.pdf | ||
| + | https://ccl.northwestern.edu/netlogo/docs/dictionary.html | ||
Latest revision as of 19:39, 17 January 2017
Project name: Traffic simulation
Class: 4IT496 WS 2016/017
Author: Jakub Vitvar (xvitj27)
Model Type: Agent-based simulation
Software used: NetLogo 6.0 with Network and RND extension
Contents
Introduction
This project is simple traffic simulation, that shows the effect of highway closures on nearby neighborhoods.
Problem definition
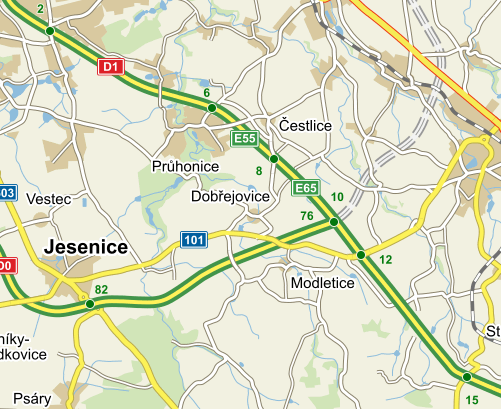
This project aims to show the problem of increased traffic through nearby cities during traffic jams on D1 highway. D1 Highway is the main connection between two big cities in the Czech Republic and there are a lot of sub-urban areas in close aproximity to Prague and D1 highway.
During traffic problems on D1 all the traffic tries to find alternative way through those suburban areas. This simulation aims to show how much traffic goes through those sub-urban areas in case of D1 closures between certain exits.
Method
As we are trying to simulate individual drivers the agent-based aproach seems to be appropriate. I decided to simulate the real world enviroment with weighted graph. In order to simplify the problem I chose to ignore two-way traffic and simulate only traffic that starts in Prague. To get the right amounts of traffic I used the information gathered by ŘSD (Ředitelství silnic a dálnic) in 2011. From that information I created probability of traffic leaving highway on each exit.
Drivers then simply follows these probability to their destinations. Along the way they follows the shortest path and avoids blocked sections.
Model
Each car is simulated as one agent that tries to find shortest path from its starting location and its destination. The only parameter for these agents is time. Every road is weighted by the time it takes to move from starting node to end node.
User has ability to set the amount of cars in the network and block certain parts of the highway. The results can be viewed in the simulation and on the plots. Plot on the left side shows amount of cars on the highway and plots under the map show traffic intensity in each city.
Results
This simulation is created in NetLogo software with 2 extensions installed. First is network extension, that I use to create simulated enviroment and calculate shortest weighted paths. Next extension is RND,that is needed to set correct probability to each destination.
Without any blocked sections all the traffic moves according to the ŘSD study. For example approximately half of the traffic continues on the way to Brno and second most traffic leaves on Exit 10. That shows that model is working according to reality.
With blocked section drivers leaves the highway in such a way to find shortest path to their destination.
Conclusion
Results of this simulation are very predictable as the model of the enviroment is very simple. The results are still relevant as it shows correlation with the study created by ŘSD. In order to provide more interesting results all the roads and cities would have to be implemented.
Another problem comes with simulation of the drivers. In this simulation the only motivation for a driver is the time spend on the road. In real world many drivers prefer different paths based on shorter distance, tolls and other incentives.
Code
Sources
http://www.ceskedalnice.cz/prilohy/intenzity-2012.pdf https://ccl.northwestern.edu/netlogo/docs/dictionary.html


