Difference between revisions of "Traffic Accident Risk Analysis"
Sim timm03 (talk | contribs) (→Interface) |
Sim timm03 (talk | contribs) (→Interface) |
||
| Line 42: | Line 42: | ||
=== Interface === | === Interface === | ||
| − | [[File: | + | [[File:Interface_timm03.png]] |
Early experiments show that: | Early experiments show that: | ||
Revision as of 19:48, 10 January 2025
Contents
Introduction
This page introduces a NetLogo-based simulation that models traffic accident risk. The goal is to understand how road conditions, traffic density, and driver behavior intertwine to create or mitigate accidents. Various research sources underscore the need for a systematic approach to traffic safety, illustrating how driver reliability, infrastructure, and cultural factors shape accident outcomes (Sadauskas, 2011; Gstalter & Fastenmeier, 2010; TSK Praha, 2020; Nordfjærn et al., 2011).
Definition of the Problem
Road traffic accidents remain a pressing public health challenge, especially with the steady growth in vehicle numbers worldwide (Sadauskas, 2011). This proliferation escalates the likelihood of collisions, injuries, and fatalities. A robust traffic safety strategy thus necessitates examining:
Road conditions (from good to very bad).
Driver behavior and risk homeostasis (adjusting behavior based on perceived safety).
Environmental and societal factors that influence compliance with safety rules (Nordfjærn et al., 2011).
Moreover, the complexity of urban intersections can amplify error rates, as drivers face higher cognitive loads and multiple conflict points (Gstalter & Fastenmeier, 2010). In city contexts, baseline accident rates still vary considerably depending on infrastructure, as seen in real-world data (TSK Praha, 2020).
Method
A systematic approach to traffic safety integrates engineering, enforcement, and education — often referred to as the “Triple E” (Sadauskas, 2011):
Engineering: Vehicle and road design improvements (e.g., signage, intersections, lighting).
Education: Public awareness, driver training programs targeting risk perception and behavior.
Enforcement: Legal measures (speed limits, penalties) ensuring compliance with traffic rules.
Human Reliability Analysis (HRA) has also been adapted to driving tasks to quantify driver error probabilities at intersections (Gstalter & Fastenmeier, 2010). By defining “correct” driver actions and measuring deviations, one can estimate how road geometry, age, and psycho-social factors alter driver reliability.
Model
This simulation uses NetLogo to create a grid of patches representing:
Road segments: Assigned good, bad, or very bad condition.
Intersections: Potentially with traffic lights.
Cars (turtles): Move according to lane rules and can trigger accidents based on speed, congestion, and driver-error-rate.
Key points:
Accident Probability: Derived from a base driver-error-rate, amplified by intersection complexity, road condition, and local traffic density (Gstalter & Fastenmeier, 2010; Nordfjærn et al., 2011).
Baseline Rates: Inspired by real accident data (e.g., TSK Praha’s ročenka dopravy or Accident risks of different weather conditions) (TSK Praha, 2020) (Malin 2017).
Systematic Approach: Reflects suggestions for engineering (road condition logic), education (driver-error slider), and enforcement (speed constraints) in modeling different scenarios (Sadauskas, 2011).
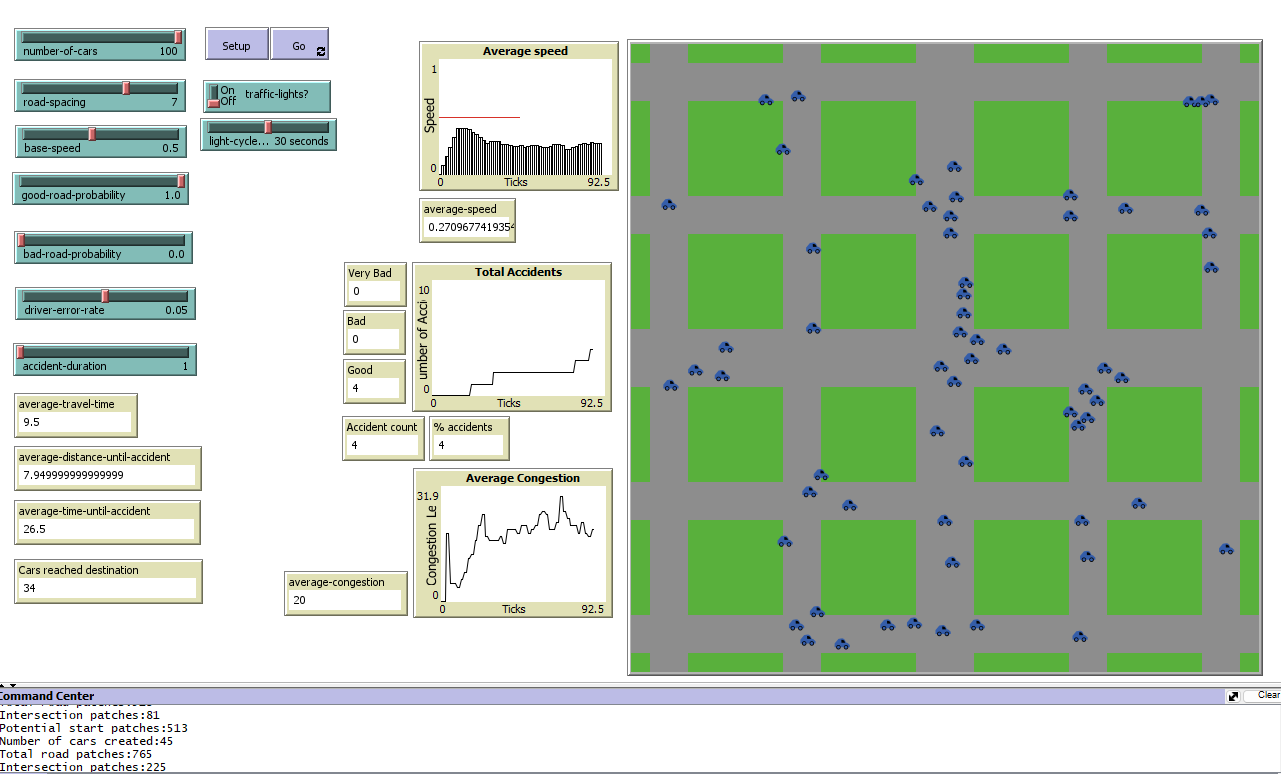
Interface
Increasing driver-error-rate or worsening road conditions leads to higher accident counts.
Intersections with complex geometry or multiple lanes see disproportionate spikes in accidents, aligning with research on urban intersection hazards (Gstalter & Fastenmeier, 2010).
Overall traffic flow slows when accidents block segments for a set duration.
Moreover, cross-cultural studies highlight that perceived risk and willingness to comply with regulations vary significantly by region, implying the simulation’s parameters may need adjusting for local contexts (Nordfjærn et al., 2011).
Conclusion
NetLogo model offers a flexible testbed for exploring how each factor contributes to — or mitigates — traffic accidents. Real-world calibration data (e.g., from TSK Praha) can refine the baseline accident probabilities, enabling more realistic scenario testing.
Code
Below is the NetLogo code implementing the simulation structure (patch definitions, accident logic, congestion metrics, etc.). Users can copy and paste it into a NetLogo environment to run their own experiments. For a complete listing, see the setup, go, and supporting procedures:
References
Sadauskas, V. (2011). Traffic safety strategies, Transport, 18(2), 79–83. DOI: 10.1080/16483840.2003.10414070
Gstalter, H., & Fastenmeier, W. (2010). Reliability of drivers in urban intersections. Accident Analysis & Prevention, 42(1), 225–234. Link
TSK Praha (2020). Ročenka dopravy – 2020. Link
Nordfjærn, T., Jørgensen, S., & Rundmo, T. (2011). A cross-cultural comparison of road traffic risk perceptions, attitudes towards traffic safety, and driver behaviour. Journal of Risk Research, 14(6), 657–684. Link
Fanny Malin (2017). Accident risks in different weather conditions. Link
