Difference between revisions of "Formula 1 teams economic situation"
(→Results) |
(→Code) |
||
| (2 intermediate revisions by the same user not shown) | |||
| Line 325: | Line 325: | ||
Let's make one final attempt. | Let's make one final attempt. | ||
| + | |||
| + | ==Creating better reasonable setup== | ||
In this setup an increase of 20 % in ''competition budget'' is achieved while share of budget for teams is set up to 75%. Also an increase of ''total advertising income'' by 20 % is accomplished. | In this setup an increase of 20 % in ''competition budget'' is achieved while share of budget for teams is set up to 75%. Also an increase of ''total advertising income'' by 20 % is accomplished. | ||
| Line 339: | Line 341: | ||
=Conclusion= | =Conclusion= | ||
| + | Formula 1 is prestigious racing series with long tradition. But it is also a business. The aim of this simulation is to predict possible future of this championship and to present options how to improve this business's outlook to the future. | ||
| + | |||
| + | As can be seen in chapter 4.1 Current state of Formula 1 there is a serious trouble right now. The risk of many teams going bankrupt is pretty high, according to simulation 3-4 teams will go bankrupt during next ten seasons. That is unacceptable because Formula 1 needs 8 teams at minimum. If 4 teams end, the Formula 1 will end as well. | ||
| + | |||
| + | Following chapters show what changes could be done and what the result could be. The last chapter of Results' part of this document 4.6 Creating better reasonable setup present what could be done to lower the mentioned risk to a minimum. That is: increasing the competition income and income from advertising by 20 % each, increasing share of the competition budget for teams to 75 % up from 63,8889 % and changing distribution model for splitting money among teams (for details please see respective chapter). | ||
| + | |||
| + | Although this simulation might not cover all possible situations, like entering of new teams (which happens rarely anyway) or gradual changes of variables etc., it provides useful insight into this topic and valuable environment for simulating changes and their possible outcomes in long term. | ||
=Code= | =Code= | ||
| − | For complete code please see attached excel file. | + | For complete code please see attached excel file: [[File:Simulation-f1-jan-zaskolny-xzasj00.xlsx]]. |
=References= | =References= | ||
Latest revision as of 00:02, 18 January 2015
- Project name: Formula 1 teams economic situation
- Author: Jan Zaškolný
- Software used: Microsoft Excel
- Simulation type: Monte Carlo
Contents
- 1 Problem definition
- 2 Method
- 3 Model
- 3.1 Structure
- 3.2 Parameters
- 3.2.1 Parameters set by user
- 3.2.1.1 Competition budget
- 3.2.1.2 Share of budget for teams
- 3.2.1.3 Share of budget split according to results
- 3.2.1.4 Extra share for top 10 teams
- 3.2.1.5 Total advertising income
- 3.2.1.6 Special annual team bonuses
- 3.2.1.7 Starting cash of teams
- 3.2.1.8 Distribution of budget by place
- 3.2.1.9 Advertising attractivity by place
- 3.2.2 Parameters calculated from others
- 3.2.1 Parameters set by user
- 3.3 Functions
- 4 Results
- 5 Conclusion
- 6 Code
- 7 References
Problem definition
At the moment there is serious trouble in the Formula 1 business as two out of eleven teams filed for bankruptcy recently during a single month. This might indicate bigger issues coming in future because the minimal number of teams to run the championship is eight (so that there are 16 cars), thus repeating the recent events could be the end of the most famous racing series. According to representatives of other smaller teams they are also on the verge of going bankrupt due to the model of budget distribution in the championship. Contribution of organizer of Championship to the budget of teams depends on results of teams but this is something that ignores system archetype called "success to successful" which is even stronger in this case because sponsors provide finance mostly to previously successful teams. What makes the situation even worse is the fact that costs to enter to championship are so high that entering of a new participants happens very rarely.
Is current model of budget distribution really a threat for Formula 1? What would happen if something gets changed? Is there a way how to save the series?
Method
Situation in Formula 1 is simulated in Excel using Monte Carlo.
Using a model with various parameters that can be set by user makes answering questions from previous chapter possible.
Model
Simulation is based on a model of the Formula 1 environment. This model consists of input parameters set by user, internal parameters and functions and predefined values like names of competing teams.
Model is based on an idea that there are some starting conditions and then situation develops accordingly to parameters. Ten seasons are simulated and then the result is evaluated with the number of teams going bankrupt as the main point.
Structure
There are several important elements in the structure of the simulation. First, there are already mentioned parameters. Then there are functions used for process values given to them. And both these are used for calculation of behavior of the Formula 1 teams.
Every team is treated separately. Each team is a unique entity for which all ten seasons are simulated. Team has a starting cash (set by parameter which user can change) and every season there are income and expanses calculated. Income consists of advertising profits, money for participation, money for achieved results, money from drivers' sponsors and other including special annual team bonus. Expenses are made of drivers, transportation, developement and miscellaneous costs and overhead. The position of the team is calculated by comparing variables called total power among all participating teams. Calculation of this variable is covered later in section Functions.
Behaviour of a team is different in various situation and depends on it's financial situation and position in previous season. Teams in bad financial shape try to cut costs; teams chasing for the first place in the competition increase their budget spent for car developement.
After ten seasons account balance of every team is inspected to decide how many teams went bankrupt in the tough competition. This calculation is done hundred times and the mean average is presented with a graph showing how many teams would go bankrupt in Formula 1 in ten years.
Parameters
The simulation works with a lot of parameters which effect the result of it. There is always pre-defined value that corresponds with the current situation in Formula 1. Some of them are more precisely known while others are partly shrouded by mystery and educated guess based on available information and past experience was inevitable. See references for the sources of information used.
Parameters set by user
Many parameters can be changed by user.
Competition budget
Competition budget is the total pool of money circulating in Formula One every year. It is distributed amongst teams and owners of the Formula One brand.
Default value: 1800
Competition budget is distributed amongst teams and owners of the Formula One brand. This parameter specifies share for the teams.
Default value: 0,638889
Part of the budget for teams minus bonuses is distributed evenly while the rest is bound to the results. This parameters sets how much is distributed according to results. Simulation tests various values of this parameter and shows how number of teams going bankrupt depends on it.
Default value: 0,88
Top ten teams receive part of the budget split according to results. Each of these teams gets one tenth of extra share for top 10 teams.
Default value: 0,4
Total advertising income
Money from advertising is a vital source of cash for Formula 1 teams. This variable specifies total budget of companies that are willing to spend their money to advertise in Formula 1 through the teams.
Default value: 1200
Special annual team bonuses
Part of budget for teams is taken away every year to give special bonuses to selected teams. Official reason for this is "a special contribution to the sport". In fact it is granted to teams with best negotiators.
Default values:
Mercedes 30
Red Bull Racing 0
Williams 30
Ferrari 90
McLaren 0
Force India 0
STR 0
Lotus 0
Marussia 0
Sauber 0
Caterham 0
Starting cash of teams
Every team starts the simulation with a specified sum of cash on their accounts. This varies as there are many factors influencing this value such as previous successes or having a strong sponsors (which lead to a high intake of money) or consecutive bad results in previous seasons (which lead to a drop in money reserves).
Default values:
Mercedes 1000
Red Bull Racing 2000
Williams 800
Ferrari 1500
McLaren 800
Force India 500
STR 1200
Lotus 500
Marussia 250
Sauber 300
Caterham 150
Distribution of budget by place
Part of budget split according to results is distributed amongst top 10 teams while the rest is given to teams according to the specific position on which they finished the season. The quotients how the money are split are set in parameters of distribution of budget by place.
Default values:
1st 0,24
2nd 0,15
3rd 0,12
4th 0,1
5th 0,09
6th 0,08
7th 0,07
8th 0,06
9th 0,05
10th 0,04
11th 0
Advertising attractivity by place
The more successful a team is, the more advertisers it gets and the higher proportion of the total advertising income it can grasp. Most advertisers want to be connected with successful teams while only a are willing to support those who just are present.
Default values:
1st 0,3
2nd 0,2
3rd 0,14
4th 0,08
5th 0,07
6th 0,06
7th 0,05
8th 0,04
9th 0,03
10th 0,02
11th 0,01
Parameters calculated from others
Some parameters are calculated from other parameters.
Budget for teams
Budget for teams is the pool of money that is distributed to teams competing in the series.
This variable is calculated by multiplying competition budget and share of budget for teams.
Default value: 1150
Budget for teams minus bonuses
Part of budget for teams is redistributed in a special way every year (see Special annual team bonuses) so in fact pool of money that are being distributed to teams is a little bit smaller.
This variable is calculated as budget for teams minus sum of special annual team bonuses.
Default value: 1000
Budget split according to results
Amount of money split according to results of teams.
This variable is calculated by multiplying budget for teams minus bonuses and share of budget split according to results.
Default value: 880
Budget split evenly
Amount of money split regardless results of teams.
This variable is calculated as one minus budget for teams minus bonuses times share of budget split according to results. It is the same as budget of teams minus bonuses minus budget split according to results.
Default value: 120
This variable is calculated as one minus extra share for top 10 teams.
Default value: 0,6
Amounts in millions USD.
Functions
Beside usual functions that add, detract, multiply or divide some values, there are some fancy functions with interesting behaviour.
Calculating advertising income
Advertising income is calculated using svyhledat function. This function searches for a given value in specified table and returns value in specified column of it.
Example:
=SVYHLEDAT(P60;$S$10:$T$20;2)*$E$20
Calculating income from participation
Income from participation is not divided evenly, because top ten teams get considerably more that eleventh team. This makes the function lengthy, but the amount is calculated suberbly.
Example:
=KDYŽ(P61<11;($E$16/11)+($E$15*$E$17/10);$E$16/11)
Total power of team
Total power of team is a value important by ranking teams in seasons. Three inputs are used for it's calculation - car level, drivers level and a random value (yes, randomness is very playing a big role too in Formula 1!).
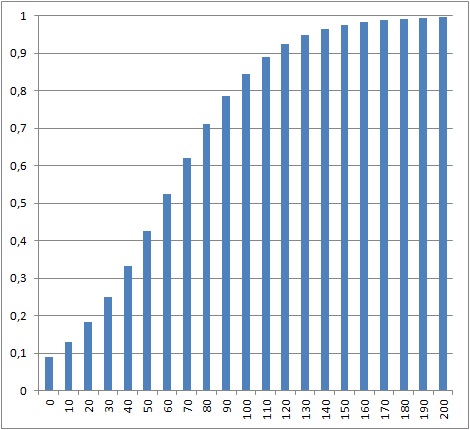
Logic behind car and drivers level is very similar. The more team spends on these the better result it gets. In fact both are magic functions that grow exponentially before reaching a point when growth starts to slow down. There is also a factor of luck (or bad luck) which is being eliminated for higher values. See image below for an example what function returns before luck comes into play.
Example: Q61 - car level
R61 - drivers level
S61 - random value
T61 - total power of team
Q61: =(1/(1+10*EXP(1)^(-0,04*J61)))+(1-(1/(1+10*EXP(1)^(-0,04*J61))))*(NÁHČÍSLO()-0,5)
R61: =(1/(1+10*EXP(1)^(-0,4*H61)))+(1-(1/(1+10*EXP(1)^(-0,4*H61))))*(NÁHČÍSLO()-0,5)
S61: =RANDBETWEEN(6;10)/10
T61: =Q61*R61*S61
To see all functions used in simulation, please download the file in the Code section of this article.
Results
Thanks to simplicity of changing simulation parameters not only current state was simulated but also some possible changes in parameters were done to show what would happen in such situation.
Current state of Formula 1
The image below shows setting corresponding to current state of Formula 1.
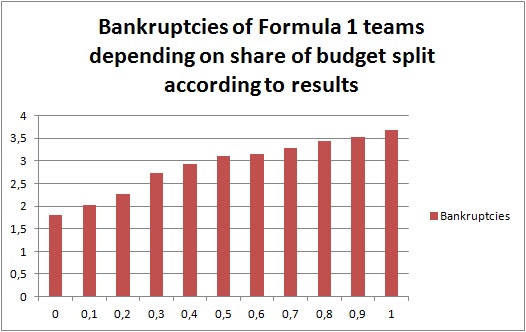
Results of simulation with these parameters folow.
As we can see according to the simulation there are going to be approximately 3,5 bankruptcies in following 10 seasons unless there is a change. This presents a serious threat as Formula 1 must have at least 8 competing teams (due to contracts with racing circuits, televisions etc.).
However, should distribution model of budget in Formula 1 change there could be only below 2 bankruptcies. That would be the case of share of budget split according to results being set to zero (now the value is 0,88). That would mean that teams would get money only for participation in the series and not for results achieved. While their revenues would be still affected by their position in the championship due to advertising income they would have a stable supply of money.
On the other hand, some might say that it would cause teams to stop competing. This could really happen but there is one important rule saying that driver must finish his qualification lap for the race not slower than for 103,5% of the winner's time - otherwise he would not be allowed to start in the race. This rule means that for such a situation to happen it would be neccessary that all teams make an agreement. And, based on observation of Formula 1 in past 20 years, that happens so rarely that it never really happened in previous decade.
Other objection could be that it would be "weird" not to reward the winner. In that situation, model could be changed from 88% based on result to eg. 25% based on result. That would decrease number of bankruptcies approximately by 1 to around 2,5 which would be bearable.
But really, could there be some other way how to change the parameters so even better result is achieved? Let's see.
Removed special annual team bonuses
A simple change - removing special annual team bonuses (setting them to zero) - leads to a small improvement in terms of financial stability. See image below.
What happens here? Extra 150 saved on these special annual team bonuses is distributed among teams according to usual rules. Three teams lose their advantage while others can compete for more money.
Equal account balance at the beginning
Graph below shows what would happen in hypothethical case of all teams starting simulation with the same account balance 1000.
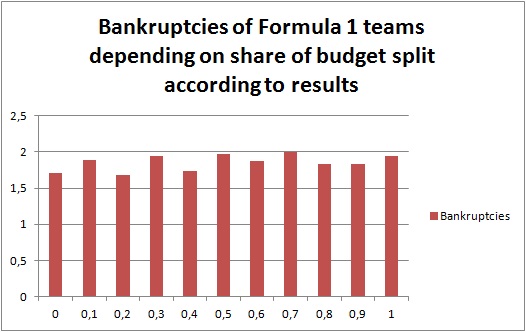
We can see that this equality helped in terms of decreasing number of bankruptcies but there are still many. Why is that? And what happens when we set companies extremely rich at the beginning? See graph below which shows what happens when every company starts with 5000.
Ha! Can you see what happened? No matter how much many we pour into companies at the beginning, someone always goes bankrupt! Increasing their money supply at the beginning makes teams to burn money faster in chase for winning the championship.
Higher total advertising income
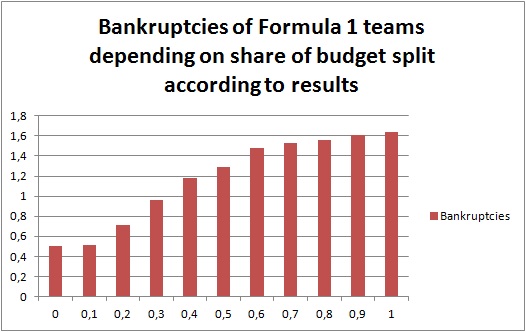
What would happen if the prestige of Formula 1 increases dramatically and more advertisers come to support teams? The graph below shows what happens when total advertising income doubles to 2400.
Wow, not bad! Not bad at all!
What happened here? Unlike in situation with high equal starting account balance, increase in advertising income improves situation a lot. This is probably because teams do not start burning all their cash quickly. Instead they spend reasonably while they have some secure steady income.
Especially when combined with a change in distribution model this change produces sustainable model. Only issue here is that it requires immediate action leading to big increase of total advertising income.
Creating a reasonable setup
Now, let's try to make a reasonable setup that will achieve low number of teams going bankrupt. See image below.
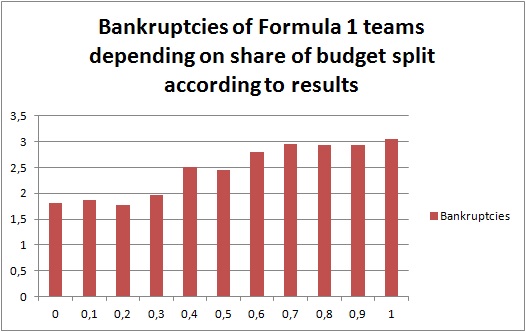
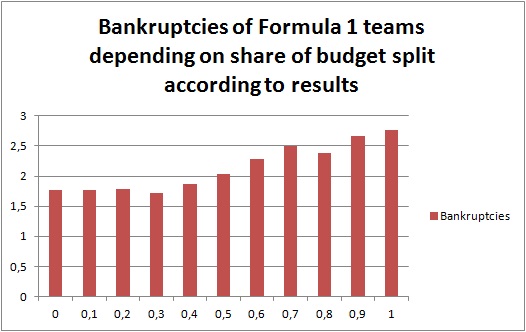
Special annual team bonuses were removed and distribution of budget by place was also slightly revamped. Please see results of the simulation on the graph below.
Not bad, but maybe you did expected even better results? Sorry, but this is economy, not a perpetuum mobile.
What happens here? What is being done is purely redistributing money in a slightly diffent way. While removing special annual bonuses and change in distribution by place achieved helps minor teams, it takes the money from major ones. And if you have a big team with a big budget it is difficult to adapt to new conditions so rapidly. So now the setting is better for the minor but worse for the major teams which can sometimes go bankrupt.
Let's make one final attempt.
Creating better reasonable setup
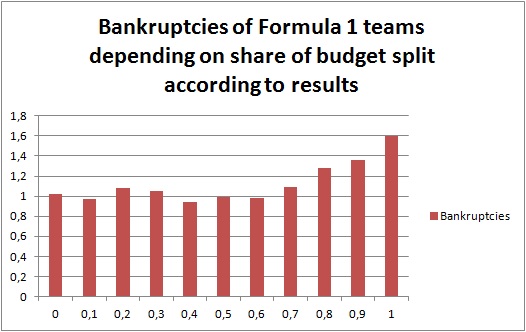
In this setup an increase of 20 % in competition budget is achieved while share of budget for teams is set up to 75%. Also an increase of total advertising income by 20 % is accomplished.
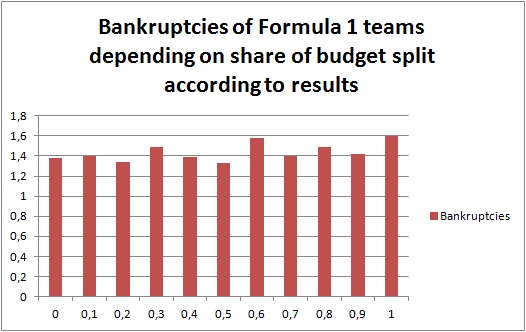
Now the situation will look according to the simulation like in the graph below.
This is fairly nice result, isn't it?
With share of budget split according to results set to 50 % there will be likely only one team going bankrupt which is much better and safer than estimate made in the first setup corresponding to current situation (3,5 teams).
Conclusion
Formula 1 is prestigious racing series with long tradition. But it is also a business. The aim of this simulation is to predict possible future of this championship and to present options how to improve this business's outlook to the future.
As can be seen in chapter 4.1 Current state of Formula 1 there is a serious trouble right now. The risk of many teams going bankrupt is pretty high, according to simulation 3-4 teams will go bankrupt during next ten seasons. That is unacceptable because Formula 1 needs 8 teams at minimum. If 4 teams end, the Formula 1 will end as well.
Following chapters show what changes could be done and what the result could be. The last chapter of Results' part of this document 4.6 Creating better reasonable setup present what could be done to lower the mentioned risk to a minimum. That is: increasing the competition income and income from advertising by 20 % each, increasing share of the competition budget for teams to 75 % up from 63,8889 % and changing distribution model for splitting money among teams (for details please see respective chapter).
Although this simulation might not cover all possible situations, like entering of new teams (which happens rarely anyway) or gradual changes of variables etc., it provides useful insight into this topic and valuable environment for simulating changes and their possible outcomes in long term.
Code
For complete code please see attached excel file: File:Simulation-f1-jan-zaskolny-xzasj00.xlsx.
References
Minimum vozů ve startovním poli je 16
Breaking Down the Costs of Racing in Formula 1: Is Spending Out of Control?
Infographic: Team F1 2014: Budget and Employees
The F1 financial structure explained (in four sentences)
Formula 1 teams showing signs of money problems
F1 v číslech: Jaké mají týmy rozpočty, kolik mají zaměstnanců a kolik dostávají na odměnách
