Difference between revisions of "Chickenpox"
(Created page with "=1. Introduction= This simulation shows the spread of the virus Chickenpox via person-to-person transmission in the isolated population. It analyzes effect of vaccination on t...") |
(→2. Problem definition) |
||
| (One intermediate revision by the same user not shown) | |||
| Line 5: | Line 5: | ||
- Author: Yauheniya Andreyuk | - Author: Yauheniya Andreyuk | ||
| + | |||
| + | =2. Problem definition= | ||
| + | Chickenpox, also known as varicella, is a highly contagious disease caused by the initial infection with varicella zoster virus (VZV). Chickenpox is an airborne disease which spreads easily through the coughs and sneezes of an infected person. The condition usually resolves by itself within a couple of weeks. The rash may, however, last for up to one month. After a chickenpox infection, the virus remains dormant in the body's nerve tissues. The immune system keeps the virus at bay, but later in life, usually in an adult, it can be reactivated and cause a different form of the viral infection called shingles. | ||
| + | |||
| + | =3. Method= | ||
| + | NetLogo 6.2. was used for this simulation. It was chosen due to the ease of visualization and quick results on a learning curve. | ||
| + | |||
| + | =4. Model= | ||
| + | |||
| + | [[File:Model.jpg]] | ||
| + | |||
| + | == 4.1. People == | ||
| + | The model contains only one turtle, which is humans. People in the simulation are divided into three groups – healthy, sick or immune (not at the beginning of the simulation, but later on). If a human is sick, he may infect other people he comes in contact with. When the person reaches a definite age he dies and is no longer relevant to the model. After the person was sick, but recovered, he also gains the immunity. People are set to move randomly. | ||
| + | |||
| + | == 4.2. Other sliders == | ||
| + | |||
| + | Infectiousness - capability of causing infection; | ||
| + | |||
| + | Vaccination-rate – percentage of vaccinated people; | ||
| + | |||
| + | Immune-time – amount of time for which the person gains immunity; | ||
| + | |||
| + | Duration – how long the person will be sick before he recovers or dies; | ||
| + | |||
| + | Chance-recover - probability that the person will recover or gain the immunity. | ||
| + | |||
| + | =Results= | ||
| + | |||
| + | I want to follow how the results will vary with the vaccination-rate changing. | ||
| + | |||
| + | == Case 1. == | ||
| + | |||
| + | Vaccination-rate = 0. | ||
| + | |||
| + | In this case we can see that population gets sick and recovers in a natural way. Without the vaccination up to 98% of the population gets sick, but recovers afterwards, but then the circle happens once again. And not surprisingly this cycles influence a lot the amount of people dying. | ||
| + | |||
| + | [[File:Capture1.PNG]] | ||
| + | |||
| + | == Case 2. == | ||
| + | |||
| + | Vaccination-rate < 10. | ||
| + | |||
| + | In this case the amount of immune people reaches up to 82% and the amount of people leaving in the area is quite stable. The amount of infected people doesn't reach even more then 12%. | ||
| + | |||
| + | [[File:Capture2.PNG]] | ||
| + | |||
| + | == Case 3. == | ||
| + | |||
| + | Vaccination-rate = 50. | ||
| + | |||
| + | In this case we can see that the amount of immune people is way bigger then infected individuals (as monitors show - 0.57 infected and 98.86 immune). | ||
| + | |||
| + | [[File:Capture3.PNG]] | ||
| + | |||
| + | =Conclusion= | ||
| + | |||
| + | It is clear from the results that the vaccination rate influences a lot the amount of immune people and the amount of sick/dying people. So it is concluded that more people care about the vaccination - more immune people are there in society - less people spread the virus and therefore less people die. For me, the vaccination rate was the most important parameter in this simulation, but changing the other parameters at the same time may give different results. The simulation has already a lot of parameters defined, but of course there is a space for improvements, for example - not always the symptoms are obvious at the very beginning, the extension to this simulation could be spreading disease without people even knowing it and capturing the amount of people dying when it is already too late to do something. | ||
| + | |||
| + | =Code= | ||
| + | |||
| + | [[File:Semestralni_priklad.nlogo]] | ||
Latest revision as of 21:31, 16 January 2018
Contents
1. Introduction
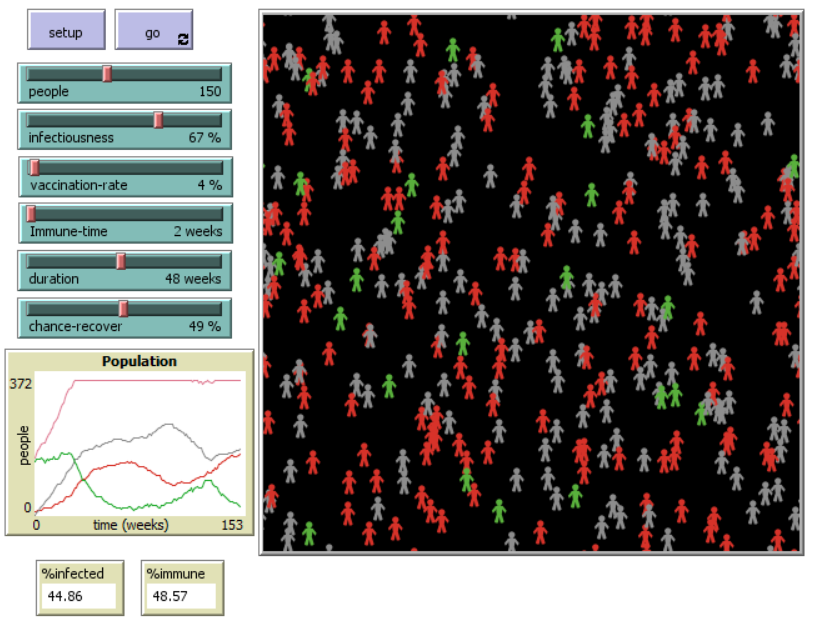
This simulation shows the spread of the virus Chickenpox via person-to-person transmission in the isolated population. It analyzes effect of vaccination on the dynamics of an infection with a person-to-person transmission and development of the immunity to the disease.
- Simulation Name: Virus Chickenpox
- Author: Yauheniya Andreyuk
2. Problem definition
Chickenpox, also known as varicella, is a highly contagious disease caused by the initial infection with varicella zoster virus (VZV). Chickenpox is an airborne disease which spreads easily through the coughs and sneezes of an infected person. The condition usually resolves by itself within a couple of weeks. The rash may, however, last for up to one month. After a chickenpox infection, the virus remains dormant in the body's nerve tissues. The immune system keeps the virus at bay, but later in life, usually in an adult, it can be reactivated and cause a different form of the viral infection called shingles.
3. Method
NetLogo 6.2. was used for this simulation. It was chosen due to the ease of visualization and quick results on a learning curve.
4. Model
4.1. People
The model contains only one turtle, which is humans. People in the simulation are divided into three groups – healthy, sick or immune (not at the beginning of the simulation, but later on). If a human is sick, he may infect other people he comes in contact with. When the person reaches a definite age he dies and is no longer relevant to the model. After the person was sick, but recovered, he also gains the immunity. People are set to move randomly.
4.2. Other sliders
Infectiousness - capability of causing infection;
Vaccination-rate – percentage of vaccinated people;
Immune-time – amount of time for which the person gains immunity;
Duration – how long the person will be sick before he recovers or dies;
Chance-recover - probability that the person will recover or gain the immunity.
Results
I want to follow how the results will vary with the vaccination-rate changing.
Case 1.
Vaccination-rate = 0.
In this case we can see that population gets sick and recovers in a natural way. Without the vaccination up to 98% of the population gets sick, but recovers afterwards, but then the circle happens once again. And not surprisingly this cycles influence a lot the amount of people dying.
Case 2.
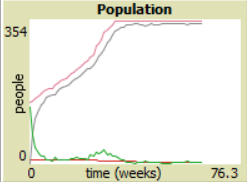
Vaccination-rate < 10.
In this case the amount of immune people reaches up to 82% and the amount of people leaving in the area is quite stable. The amount of infected people doesn't reach even more then 12%.
Case 3.
Vaccination-rate = 50.
In this case we can see that the amount of immune people is way bigger then infected individuals (as monitors show - 0.57 infected and 98.86 immune).
Conclusion
It is clear from the results that the vaccination rate influences a lot the amount of immune people and the amount of sick/dying people. So it is concluded that more people care about the vaccination - more immune people are there in society - less people spread the virus and therefore less people die. For me, the vaccination rate was the most important parameter in this simulation, but changing the other parameters at the same time may give different results. The simulation has already a lot of parameters defined, but of course there is a space for improvements, for example - not always the symptoms are obvious at the very beginning, the extension to this simulation could be spreading disease without people even knowing it and capturing the amount of people dying when it is already too late to do something.


