Difference between revisions of "Simulation of the surgery staff in a hospital"
(→Results) |
(→Results) |
||
| Line 64: | Line 64: | ||
<div>[[File:CountsOfPat2.jpg]]</div> | <div>[[File:CountsOfPat2.jpg]]</div> | ||
<div>In the other table we can see that there is waiting time for examination in average at standard patient 238,2 minutes - it is almost 4 hour. Other patients are waiting appropriate time.</div> | <div>In the other table we can see that there is waiting time for examination in average at standard patient 238,2 minutes - it is almost 4 hour. Other patients are waiting appropriate time.</div> | ||
| − | <div>[[File: | + | <div>[[File:WaitingFE23.jpg]]</div> |
We can´t solve problem of waiting time in the morning much because patients come at 7:00 and doctors start working at 9:00. there are 2 hours at least when patients have to wait. | We can´t solve problem of waiting time in the morning much because patients come at 7:00 and doctors start working at 9:00. there are 2 hours at least when patients have to wait. | ||
Revision as of 01:40, 19 January 2015
- Project name: Simulation of surgery staff in a hospital
- Class: 4IT496 Simulation of Systems (WS 2014/2015)
- Author: Martina Nováková
- Model type: Discrete-event simulation
- Software used: SimProcess
Contents
Problem definition
In this simulation the medical office in the real concrete hospital is simulated. Because in this medical office there is a long waiting time, it is necessary to optimize the number of doctors. After this optimization a patient doesn’t have to wait for more than half an hour. The goal of the simulation is to model a real process of patients waiting for examination by doctor. The main experiment shall determine how long a patient has to wait in the waiting room until he is going for the examination by doctor. If we want to make this situation real , there must be simulated other aspects, for example an examination, patients which are coming from an examination and other real situations which extend the patient waiting time.
Method
Although the discrete event simulation can be solved by some other methods, it looks like a good idea to solve it with SIMPROCESS at first sight. Making processes in this simulation tool is clearer and simpler than in other simulation tools like Netlogo and so on. A simulation can be illustrated in simple processes. You can make easy two or x-level system which is linked.
Model
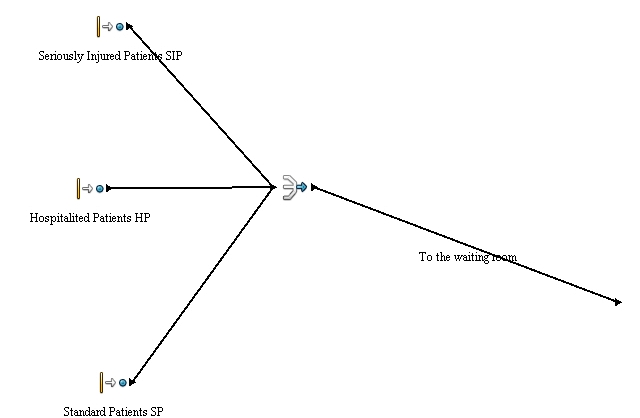
This model of simulation is divided in three main processes. These three processes are “Incoming patients”, the complex process “Examination” and the simple process “Going home“. The illustration below depicts a patient moving to the examination by doctor in his office. A patient could be sent for the examination, stay in hospital, or he could be sent home for waiting for results. The model is based on real numbers from the hospital information system and on information from employees who work in this part of hospital.
Entities
Resources
Processes
Queue is divided by entities. There is the difference between standard, seriously injured and hospitalized patients. Seriously injured patients (SIP) are preferred over others and they are pre-examined at first. This pre-examination is done by a nurse or a doctor from other staff and is determinative for further procedure. The patient could be sent to the intensive care unit if his injury is really serious (this is around 45% of patients) or he can be sent to the office (this is about 55%). Hospitalized patients have no other branch off. Standard patients are coming from outside of hospital and there is one branch off which is divided by percent. It is because of there are 9%of patients who don’t want to wait and leave the waiting room before an examination by doctor. Other 91% are waiting for an examination by doctor.
This part of simulation simulates examination or treatment by the doctor. It is illustrated by normal distribution Nor(10.0, 3.0, 1) in minutes. In the next step after examination by the doctor it is decided if a patient needs another examination (for example CT, X-ray, MR or other blood tests. There are usually 30% of patients who need another examination. 55% of patients are sent home. And the rest (15%) stays in the hospital and are hospitalized.
This simulates other examinations which are needed for right decisions of a doctor in the office. There is used exponential distribution Nor (15.0, 3.0, 1) minutes. After this patients can be sent back to the waiting room (95%), or can be sent home (5%) because results will be known after 20-23hours. These patients go home, but there are 2% of them who don’t come back to get their results. The rest (98%) comes back for their results. The distribution of the time when they come back is given by triangular distribution Tri (22.0, 23.0, 23.5).
Results
We can´t solve problem of waiting time in the morning much because patients come at 7:00 and doctors start working at 9:00. there are 2 hours at least when patients have to wait.
Conclusion
Making a model of a specific medical staff is quite complicated. It is important to deal with some detailed and unpredictable problems. People(resources) are very unpredictable and system is very complex.
Despite all limitations this simulation can help with optimization of the number of doctors and shows quite real process of patient althought it coud be very complex.


