Difference between revisions of "Urban Traffic Flow Optimization"
m (mistake spotted) |
(→Urban Traffic Flow Optimization Simulation Report) |
||
| Line 1: | Line 1: | ||
| − | = Urban Traffic Flow Optimization Simulation Report = | + | = Urban Traffic Flow Optimization Simulation Report by stej34= |
== 1. Definition of the Problem == | == 1. Definition of the Problem == | ||
Latest revision as of 21:05, 10 January 2025
Contents
Urban Traffic Flow Optimization Simulation Report by stej34
1. Definition of the Problem
Urban traffic congestion remains a persistent challenge for city planners and transportation engineers. Increasing numbers of vehicles, coupled with pedestrian traffic, can lead to bottlenecks at intersections, elevated emissions, and diminished quality of life. This simulation project tackles the problem of optimizing traffic flow in a simplified but representative urban setting, focusing on traffic-light coordination, vehicle flow, and pedestrian impact.
2. Method
In exploring solutions, multiple methods exist—analytical models (e.g., queueing theory), microscopic traffic simulations, or agent-based approaches. I chose a multi-agent simulation in NetLogo because:
- It allows straightforward implementation of varying driver and pedestrian behaviors.
- It supports fine-grained control over traffic-light timing and road capacity.
- It provides user-friendly plotting and monitoring features.
Other alternatives, such as mathematical queueing models, could be more abstract but offer less visual feedback on individual agents. Commercial traffic simulators (e.g., VISSIM) are powerful but may be less accessible for quick prototyping. Therefore, NetLogo strikes a good balance between detail, accessibility, and extensibility.
3. Detailed Model Description
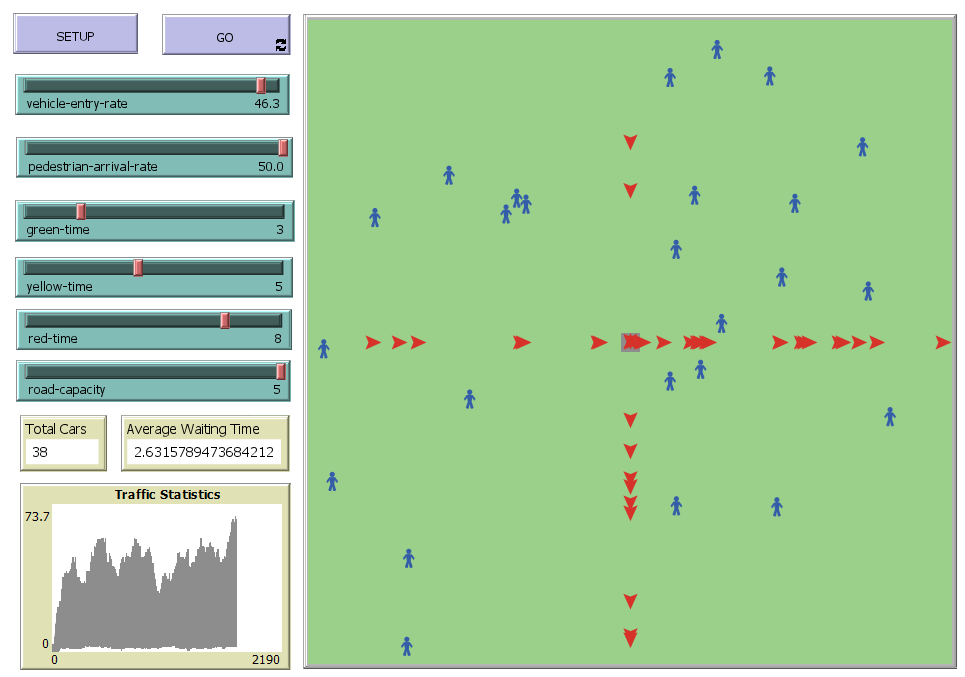
Parameters (Sliders)
- vehicle-entry-rate: Determines how frequently cars enter the simulation (vehicles per 100 ticks).
- pedestrian-arrival-rate: Controls how many pedestrians spawn, mimicking real-life crosswalk usage.
- green-time, yellow-time, red-time: Define the durations of each traffic-light phase, allowing users to simulate different strategies (long green phases vs. more frequent switching).
- road-capacity: Sets how many cars can occupy a road patch before exceeding capacity and forcing waiting or slower speeds.
Model Logic
- Traffic Lights: Two lights at a central intersection cycle through green, yellow, and red. Cars must stop on red (and sometimes choose to stop on yellow).
- Vehicles: Cars spawn at the edges and move toward the intersection, potentially slowing or stopping for red lights, pedestrians, or capacity constraints. Once they exit the simulation boundary, they are removed.
- Pedestrians: Pedestrians spawn near the center, walk randomly (or across roads), and slow vehicles if they are on the road. They exit when leaving the boundary.
- Data Collection:
Monitors record total cars in the system and average waiting time. Plots illustrate changes in car count and waiting time over each tick.
Assumptions and Simplifications
- The environment is a 2D grid with a single intersection.
- Pedestrians can slow down cars just by proximity; real-world behaviors are more complex.
- We assume cars exit immediately after crossing the outer boundary (no surrounding network).
4. Results
Key Observations
- Traffic Light Timing: Matching green and red durations to traffic volume significantly reduces average waiting time. In scenarios with longer green phases, total delays decreased—up to a point. Overly long phases, however, can cause buildup in the perpendicular direction.
- Pedestrian Impact: Higher pedestrian-arrival rates raised average waiting times for vehicles, especially when they were forced to slow to near-stop speeds on the roadway.
- Road Capacity: When too many cars occupy the road, waiting times grow rapidly. Optimally distributing cars (e.g., with balanced traffic flow) prevents dramatic queue buildups.
Real-World Applicability in the Czech Republic
This simulation, while simplified, can offer practical insights for specific locations:
- Brno (near Masaryk University): Streets like Veveří or Kounicova often combine vehicle and pedestrian flows. Adjusting traffic-light intervals while allowing frequent pedestrian crossings could streamline peak-hour traffic.
- Ostrava (Sady 28. října): High tram and pedestrian usage requires carefully timed lights to mitigate congestion. Scenario testing in the simulation can guide how short or extended green phases might help balance foot and vehicle traffic.
- Prague (Anděl intersection in Smíchov): A bustling area with shoppers and commuters—tight synchronization of lights, shorter pedestrian phases, and regulated vehicle entry rates can improve throughput while maintaining walkability.
5. Conclusion
By defining the problem of urban congestion and employing an agent-based method, the simulation successfully demonstrates how coordinated traffic-light timing, road capacity considerations, and pedestrian frequency all interrelate. The results highlight key strategies for reducing waiting times and improving overall flow. Adjusting parameters in this model can inform actual municipal decisions, helping planners test scenarios before committing to costly real-world interventions.
6. References
- Traffic Congestion and Urban Planning
- Effects of Traffic Signal Timing on Urban Traffic Flow
- Pedestrian Impact on Traffic Flow Dynamics
- NetLogo official documentation: https://ccl.northwestern.edu/netlogo/docs/
- Agent-Based and Individual-Based Modeling: A Practical Introduction (2nd ed.). Princeton University Press: https://press.princeton.edu/books/paperback/9780691190839/agent-based-and-individual-based-modeling
- Introduction to Agent-Based Modeling: Modeling Natural, Social, and Engineered Complex Systems with NetLogo. MIT Press: https://mitpress.mit.edu/9780262731898/introduction-to-agent-based-modeling/
