Difference between revisions of "Atlantic Bluefin Tuna Population"
(→Code) |
(→Model) |
||
| (12 intermediate revisions by the same user not shown) | |||
| Line 12: | Line 12: | ||
=Method= | =Method= | ||
| + | The assignments was divided into 3 parts: | ||
| + | *Literature review of current insights into the life and state of the BFT. | ||
| + | *Data collection and puttin them into perspective with each other. This way a small overview of BFT was created. | ||
| + | *Creation of the model. | ||
| + | |||
== Research == | == Research == | ||
As a first step, an extensive research was conducted to gather the most relevant papers, articles and other sources, concerning BFT population, farming, quotas, statistics, environment and fishing. | As a first step, an extensive research was conducted to gather the most relevant papers, articles and other sources, concerning BFT population, farming, quotas, statistics, environment and fishing. | ||
| Line 110: | Line 115: | ||
<b>Image 7.</b> Tuna quota set by ICCAT for each state fishing in the Western Atlantic and the Mediterranean [14]. | <b>Image 7.</b> Tuna quota set by ICCAT for each state fishing in the Western Atlantic and the Mediterranean [14]. | ||
| − | === Historical catches === | + | === Historical catches vs weather === |
To provide some insight on the topic of human-unrelated tuna stock changes happening in cycles, an image of the last 400 years tuna catch records is presented next to a graph with the temperature fluctuations, especially during the so-called little ice age. On one hand, it appears, that the temperature changes and number tuna catches are correlated. On the other it might be nothing but a conincidence. | To provide some insight on the topic of human-unrelated tuna stock changes happening in cycles, an image of the last 400 years tuna catch records is presented next to a graph with the temperature fluctuations, especially during the so-called little ice age. On one hand, it appears, that the temperature changes and number tuna catches are correlated. On the other it might be nothing but a conincidence. | ||
[[File:historicaltunacatches.png]][[File:littleiceage.png]] | [[File:historicaltunacatches.png]][[File:littleiceage.png]] | ||
| − | <b> | + | <b>Image 8 and 9.</b> Historical tuna catches. From the bold line, it is apparent, that the catches fluctuate in very similar about 110 years intervals. Therefore the hypotheses is presented, that the tuna stock is independent on human fishing exploitation [6] and [5]. The second image shows worldwide temperature changes, avilable [https://skepticalscience.com/coming-out-of-little-ice-age.htm here]. |
| + | == Model creation == | ||
| + | After the research and data collection, a model was put together in the programme Vensim based on the data and research findings. | ||
= Model = | = Model = | ||
| + | Two points of view were taken regarding the BFT population. One was focused on the adults and juveniles separately, the other was taking account the population as a whole. Both models can be found [[http://www.simulace.info/index.php/File:BFTmodels.zip]]. | ||
| + | |||
| + | == Emphasis on adults and juveniles == | ||
| + | The following equations were used in the model: | ||
| + | |||
| + | <math> Spawning = Spawning Adults * nrOf Eggs Randomly Generated </math> | ||
| + | |||
| + | <math>SpawningAdults = Adults*0.22*0.4*0.5</math> | ||
| + | |||
| + | Spawning adults are calculated as 22 % of the population (the most recent data available), divided by 2 (according to research, BFT spawns every 2 to 3 years) and a coefficient of 0.4 was added to mimic the female population (due to higher mortality, there is less females than males). The number of eggs is not in millions but in thousands to not need to divide the result by 1000 to provide juvenile weight in metric tonnes (a young juvenile starts at around th weight of 1 kg). | ||
| + | |||
| + | <math> Juveniles = (Spawning - Growth) * 12 </math> | ||
| + | |||
| + | Juveniles is the nmber of spawned times 12 (that is the amount of kgs grown in the first year of life). | ||
| + | |||
| + | <math>Growth = Juvenile Mortality * Juveniles * 2 </math> | ||
| + | |||
| + | Juvenile mortality is randomly picked between 0.29 and 0.49. It is multiplied by 2 to mimic growth to adult size (BFT is considered an adult at around the weight of 24 kg). | ||
| + | |||
| + | <math>Adults = Growth - Deaths</math> | ||
| + | |||
| + | <math>Deaths = (Adult Mortality * Adults) + Legal Fishing + Illegal Fishing</math> | ||
| + | |||
| + | Adult mortality is set at 0.1 according to research. | ||
| + | |||
| + | <math>Quota = 36 000 (variable)</math> | ||
| + | |||
| + | This number can be changed via the slider. | ||
| + | |||
| + | <math>Legal fishing = Quota</math> | ||
| + | |||
| + | To simplify the model, fishing is set to the actual quota. | ||
| + | |||
| + | <math>Illegal fishing = Quota * (0.3 - 1.5)</math> | ||
| + | |||
| + | Coefficient is randomly chosen based on numbers from research. | ||
| + | |||
| + | |||
| + | Therefore, the entire BFT population should be calculated as: | ||
| + | |||
| + | <math>Population = Juveniles + Adults</math> | ||
| + | <math>Population = ((Adults*0.22*0.4*0.5 * nrOf Eggs Randomly Generated) | ||
| + | - Juvenile Mortality * (Adults*0.22*0.4*0.5 * nrOf Eggs Randomly Generated))*12 | ||
| + | + (Juvenile Mortality * Juveniles * 2 - (Adult Mortality * Adults) + Quota + Quota*coefficient) </math> | ||
| + | |||
| + | Stock and flow diagram model created in Vensim for the adult and juveniles point of view. | ||
| + | [[File:adultsandjuveniles.png]] | ||
| + | |||
| + | == Whole population point of view == | ||
| + | <math>BFTsSpawned = EggsLaid/1000</math> | ||
| + | |||
| + | <math>EggsLaid = SpawnableStock*(randomly chosen, 5 - 45 million)</math> | ||
| + | |||
| + | <math>SpawnableStock = AdultBFTs/2</math> | ||
| + | |||
| + | <math>AdultBFTs = BFTpopulation*0.22*0.4</math> | ||
| + | |||
| + | <math>BFTpopulation = BFTsSpawned*12 - DeadBFTs</math> | ||
| + | |||
| + | <math>DeadBFTs = AdultMortality + Fishing + Juvenile Mortality + IllegalCatches</math> | ||
| + | |||
| + | <math>Quota = 36000(variable)</math> | ||
| + | |||
| + | <math>Fishing = Quota</math> | ||
| + | |||
| + | <math>Illegal catches=Quota*(random 0.3 - 1.5 coefficient)</math> | ||
| + | |||
| + | <math>Adult Mortality = AdultBFTs*0.1</math> | ||
| + | |||
| + | <math>JuvenileMortality = BFTsSpawned*12*(randomly chosen 0.29 - 0.41 coefficient)</math> | ||
| + | |||
| + | Vensim model focusing on the BFT population as a whole. | ||
| + | |||
| + | [[File:populationPOV.png]] | ||
=Results= | =Results= | ||
| + | The results have varied very strongly depending on the starting number of 1) juvenile population or 2) the selected population as a whole. Due to the fact, that the BFT population is marked as unknown in size in most sources a different tool might be more beneficial for this task. This might include the usage of random forests (as they were already used as a solution to the problem of biomass and mortality indexes [4]). Or perhaps the use of Monte Carlo for the initial starting points, yet there might be the issue of getting to the right data, because most BFT data are focused on the numbers of BFT caught and other statistics map only a selective part of the population, usually to provide scientific data about the behaviour, size and weight based information about the wild BFT stocks. | ||
=Conclusion= | =Conclusion= | ||
| + | In conclusion, the BFT population is not in a healthy state. Most of the individuals are too young to reproduce and to make matters worse, juveniles are often caught by fishing boats, so they do not grown into adults to reproduce. Therefore, measures should be taken to prevent overfishing of the younger fish in order to provide a solid base for tuna reproduction in the future. The instilled quota are definately the way to go to preserve the remains of the species, yet the problem of illegal tuna fishing should be addressed. Unfortunately, the black market with BFT will continue unless the demand for tuna meat will drop. So the fate of BFT is also partly in the hands (or stomachs) of the consumers, who decide whether they will demand more delicious tuna meat for sushi and other dishes, in order to help preserve this graceful and swift species. Another aspect, is of course, the tuna fishing lobby, that is trying to keep the tuna quota as high as possible, ignoring the advice of scientists to lower quota quite dramatically, but that is still in correlation with the profit obtained from selling tuna meat. | ||
=Citations= | =Citations= | ||
Latest revision as of 20:27, 20 January 2020
Bluefin tuna (thunnus thynnus) is found in the Pacific and Atlantic Oceans. Tunas can live up to 40 years and grow over 4 m and weight more than 600 kg, yet typical specimen is half that size. In the Atlantic the species is divided into two stocks - Eastern and Western. It is estimated that the bluefin tuna population has fallen by 80 % since 1970s [1]. Bluefin tuna is extremely popular especially in Japanese cuisine. This has caused a huge decline in the Pacific Bluefin Tuna species; it is estimated that only around 13 to 20 000 tonnes remain in the Pacific Ocean. Therefore, various organisations are attempting to take measures to prevent this tuna species to die out.
It is thought that Atlantic Bluefin Tuna (or BFT for short) might face the same fate soon, if nothing is done and the species will continue to be overexploited. BFTs are referred to as “pandas of the ocean”. Their survival is crucial to provide reassurance and hope that the humankind is able to pull the worldwide sustainability crisis back from the brink of collapse [2].
Problem definition
It is thought that the numbers of tuna populations have plummeted due to overfishing. Yet some studies claim, that overfishing is not the main cause of the tuna population reduction. Christelle Ravier and Jean-Marc Fromentin [3] in their paper "Long-term fluctuations in the eastern Atlantic and Mediterranean bluefin tuna population" came to the conclusion that the bluefin tuna population may be influenced by biotic and environmental factors more than by overexploitation.
In this study [4] the researchers came to the conclusion, that about 1/3 of the fisheries located in the eastern Atlantic and the Mediterranean are overfished. The Mediterranean is also one of the main areas for the BFT. As BFTs are warm-blooded fish, they spawn in warm waters. Also, from the historic point of view, there is data available on fishery overexploitation even from the 16th century.
Therefore, the aim of this simulation is to create a model based on available data to answer the question, whether overfishing is truly the only reason of tuna population decline.
Method
The assignments was divided into 3 parts:
- Literature review of current insights into the life and state of the BFT.
- Data collection and puttin them into perspective with each other. This way a small overview of BFT was created.
- Creation of the model.
Research
As a first step, an extensive research was conducted to gather the most relevant papers, articles and other sources, concerning BFT population, farming, quotas, statistics, environment and fishing.
The most relevant appeared to be:
- The impact of massive fishing of juvenile Atlantic bluefin tunas on the spawning population (1949-2010) – by José L. Cort and Pablo Abaunza [5]
- Atlantic bluefin tuna: population dynamics, ecology, fisheries and management – by Jean-Marc Fromentin and Joseph E. Powers [3]
- Bluefin tuna (Fisheries – European Comission) [1]
- Consequences of variations in carrying capacity or migration for the perception of Atlantic bluefin tuna (Thunnus thynnus) population dynamics – by Jean-Marc Froemntin and Laurence T. Kell [6]
- Forty years of fishing: changes in age structure and stock mixing in northwestern Atlantic bluefin tuna (Thunnus thynnus) associated with size-selective and long-term exploitation – by Siskey et al. [7]
- Long-term fluctuations in the eastern Atlantic and Mediterranean bluefin tuna population – by C. Ravier [4]
- Report of the standing committee on research and statistics – by ICCAT [8]
- Science-based management will ensure a healthy future – by Richard Herrmann [9]
- Sustainability of Atlantic Bluefin Tuna Stocks: The Problem of Overfishing – by Erini Lemos [2]
- The spectre of uncertainty in management of exploited fish stocks: The illustrative case of Atlantic bluefin tuna – by Jean-Marc Fromentin et al. [10]
Data Acquisition
Most data are available only in a relative notation (usually in metric tonnes), due to the fact that the actual numbers of BFT are not known and the population is (guess)estimated based on the BFT caught, tagging initiatives and BFT catching for scientific purposes. Yet it is a stated fact, that the BFT is an endangered species by the World Wildlife Fund (WWF) [11].
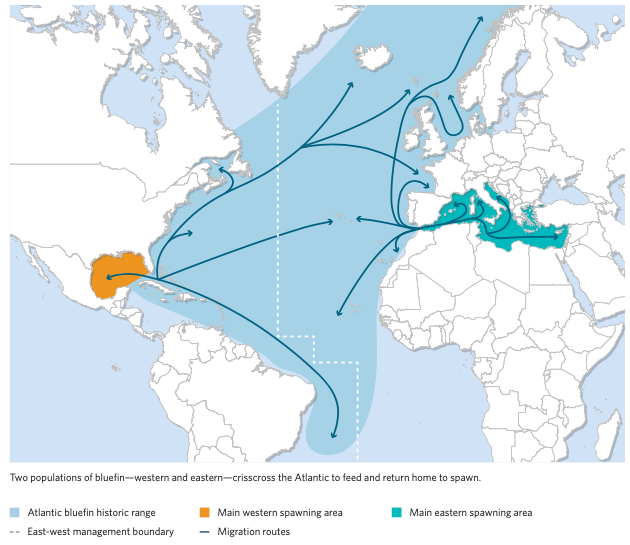
Image 1. The map and definition of BFT into two stocks based on their spawning areas [9].
According to [10]: „..ABFT population structure is likely to be more complex than the current two stocks hypothesis, with probably at least two populations within the Mediterranean. If this is confirmed, ICCAT might need to change the current two stock management framework to avoid the risk of eroding the Mediterranean bluefin tuna sub-populations,…„. For the purposes of this assignment, the BFT is divided only to two groups – Eastern and Western.
Current state
In [4] indexes are introduced to hep to determine whether the BFT population displays any signs of being overfished or of overfishing. The biomass index presents Failed to parse (MathML with SVG or PNG fallback (recommended for modern browsers and accessibility tools): Invalid response ("Math extension cannot connect to Restbase.") from server "https://en.wikipedia.org/api/rest_v1/":): {\displaystyle {Current Biomass (B) \over B producing MSY (B_MSY)} } and fishing mortality index presents Failed to parse (MathML with SVG or PNG fallback (recommended for modern browsers and accessibility tools): Invalid response ("Math extension cannot connect to Restbase.") from server "https://en.wikipedia.org/api/rest_v1/":): {\displaystyle {Current Fishing Moratility (F) \over F producing MSY (F_MSY))} } . MSY stands for maximal sustainable yield. When Failed to parse (MathML with SVG or PNG fallback (recommended for modern browsers and accessibility tools): Invalid response ("Math extension cannot connect to Restbase.") from server "https://en.wikipedia.org/api/rest_v1/":): {\displaystyle B < B_MSY} it signals of the species being overfished, when Failed to parse (MathML with SVG or PNG fallback (recommended for modern browsers and accessibility tools): Invalid response ("Math extension cannot connect to Restbase.") from server "https://en.wikipedia.org/api/rest_v1/":): {\displaystyle F > F_MSY} it signals overfishing.
| Tuna Stock | Biomass Index | Fishing mortality index |
| Western BFT | 0.48 | 0.85 |
| Eastern BFT | 1.73 | 0.24 |
| median | 1.12 | 0.81 |
Table 1. Source [4]. Indexes were produced by using 10 000 random trees an data from the last 10 years. The results show, that even though there are no sign of overfishing, the BFT is being overfished.
Spawning
According to [3] BFT does not spawn every year. In captivity, female BFT spawned every 2 – years. Also, the spawning happens after the female reaches a certain age (4 or 7 depending on the subspecies, but at age 5 tunas are view upon as mature or the BFT weighing around 25 kg [8]). The number of eggs laid is based off the age (the older the fish, the bigger in size) of the female. One female can lay anywhere from 5 to 45 million eggs. Warm temperatures tend to provide better spawning conditions [3]. Temperature fluctuations are believed to be related to changes in spawning, which might explain the 100 – 120 years cycle of the changes of the tuna population. Even though tunas can withstand temperatures from 3 to 30 degrees Celsius, spawning takes place in water > 24 degrees Celsius [3].
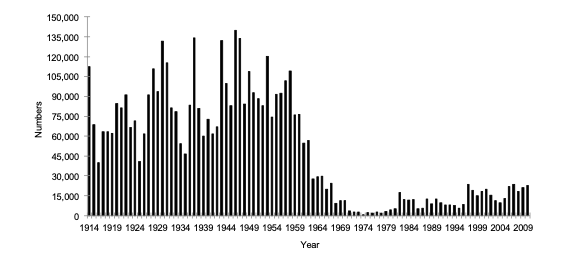
Image 2. Spawning catches in the Meditteranean [5].
Mortality rate
The annual mortality rate of juvenile BFT is around 0.24 – 0.49 and for adult BFT it is 0.1 , yet it is higher for female adult BFT [3]. The higher mortality rate for juvenile BFT is caused by being fished or caught for tuna ranching, environment or population density.
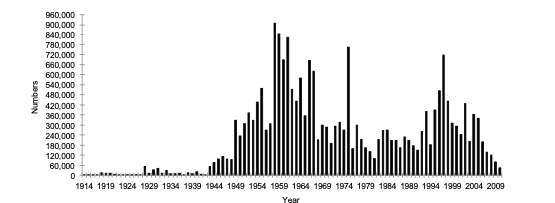
Image 3. Juvenile catches in the Mediterranean [5].
Fishing
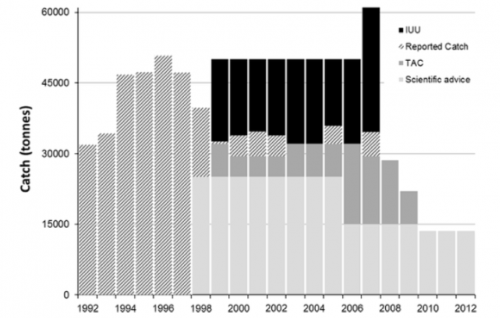
BFT accounts for only 1 % of annual tuna catches (around 4.9 million metric tonnes of tuna are fished each year according to the ISS foundation [12]). BFT accounts for only 1 % of annual tuna catches (around 4.9 million metric tonnes of tuna are fished each year according to the ISS foundation [12]). This decade, around 40 – 50 000 metric tonnes of BFT were caught each year, which is way more, than the scientist advice. But, of course, there is a lot of money involved in the BFT market, so there is a movement trying to bump up the quota, that are being instilled.
Image 4. Graph displaying the difference between actually caught BFT vs science advised numbers to preserve the species[10].
ICCAT provides a yearly statistics on the number of tonnes of tunas and tuna-like fish were caught each year since 1950. These documents can be obtained from their online database. Only the data for the atlantic BFT were used for the purposes of this assignment.
BFT Population
According to The Pew Chartiable trust the population of BFT has risen since the 1995 thanks to the measures taken [13]. [2]
| Tuna Stock | 1995 | 2010 |
| Western BFT | 10 000 t | 10 000 t |
| Eastern BFT | 200 000 t | 350 000 t |
| total | 210 000 t | 360 000 t |
Table 2. Estimated number of adult BFT in 1995 and 2010 [13].
These numbers look very optimistic and it might seem such as the species is on the right track to augment. Yet according to [2] this might not be the case.
| Tuna Stock | 1995 | 2007 |
| spawning stock | 201 479 t | 78 724 t |
Table 3. So even though the population got bigger, the spawning stock is only a fraction (22 %, a bit more than a fifth) of it [2]. This is caused by the fact, that even juvenile BFT are fished and do not reach the mature stage to be able to spawn.
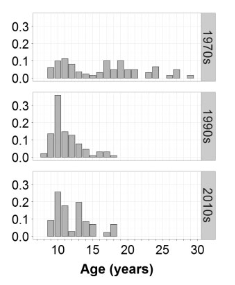
Most of the population is younger than 10 years, compared to decades before, when the ages were more evenly distributed. But unlike in the 90s it seems as if the population is slowly rebuilding thanks to the measures taken (or it might be cause by the fact, that in the 90s less specimen were caught and evaluated).
Image 5. Tuna distributed by age. 1970s (N = 350), 1990s (N = 234), and 2010s (N = 1359) [7].
Quota
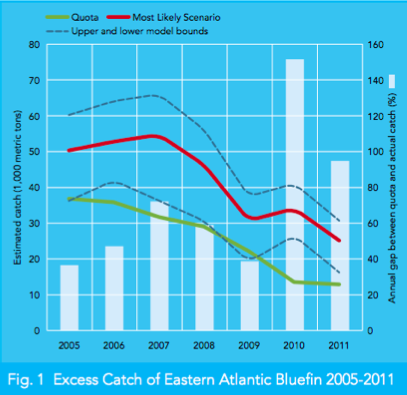
To preserve the species, some organisations (and scientists) are trying to reduce the quota for BFT caught. For example, the eastern BFT is supposed to be lowered from 28 000 tonnes to 13 500 tonnes [12]. This should result in a maximum of 31 500 tonnes of BFT caught annually. The western BFT is regulated to 25 000 tonnes [3]. The secondary effect of the quotas instilled, is illegal fishing for BFT. It is assumed, that the illegal catch is likely 2x as high as the actual reported tuna catches[2]. Obviously the high demand for the BFT meat is here to blame and the prices, for which the BFTs are sold, are outrageous. Therefore, some organisation try to educate a persuade the consumers to take BFT off their menu now (and say goodbye to their beloved sashimi and other BFT foods) to let the species restore, rather than to take the tuna off the menu forever due to no BFTs being left.
Image 6. A graph showing the estimated illegal tuna catches vs. informed catches and the % gap between them [2].
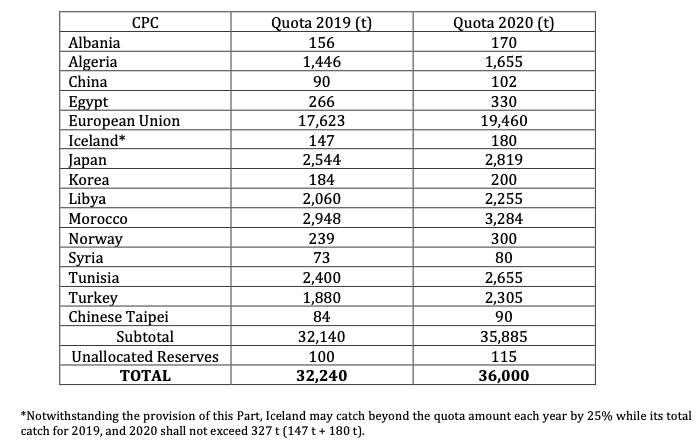
The quota for 2019 and 2020 were set by ICCAT as: "The total allowable catches (TACs) for the years 2019-2020 shall be set at: 32,240 t for 2019 and 36,000 t for 2020, in accordance with the following quota scheme. [14]"
Image 7. Tuna quota set by ICCAT for each state fishing in the Western Atlantic and the Mediterranean [14].
Historical catches vs weather
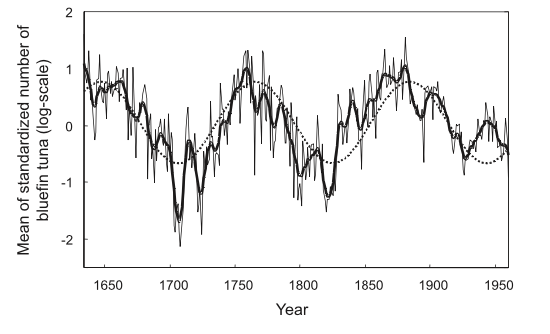
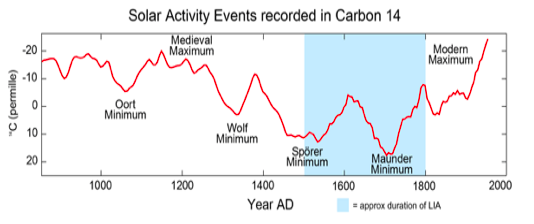
To provide some insight on the topic of human-unrelated tuna stock changes happening in cycles, an image of the last 400 years tuna catch records is presented next to a graph with the temperature fluctuations, especially during the so-called little ice age. On one hand, it appears, that the temperature changes and number tuna catches are correlated. On the other it might be nothing but a conincidence.
Image 8 and 9. Historical tuna catches. From the bold line, it is apparent, that the catches fluctuate in very similar about 110 years intervals. Therefore the hypotheses is presented, that the tuna stock is independent on human fishing exploitation [6] and [5]. The second image shows worldwide temperature changes, avilable here.
Model creation
After the research and data collection, a model was put together in the programme Vensim based on the data and research findings.
Model
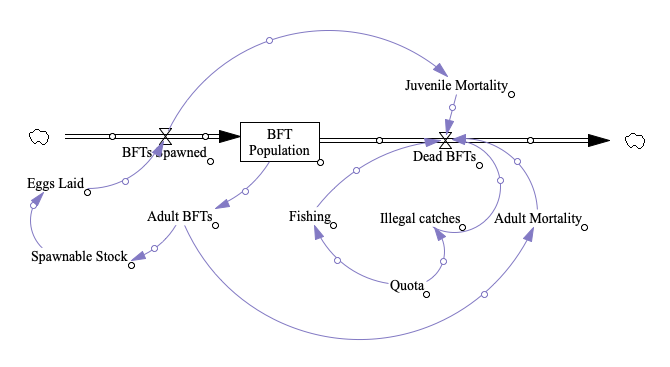
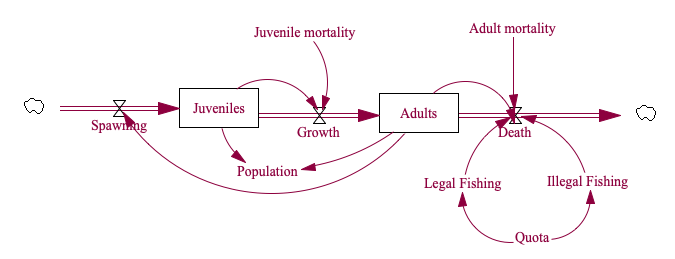
Two points of view were taken regarding the BFT population. One was focused on the adults and juveniles separately, the other was taking account the population as a whole. Both models can be found [[1]].
Emphasis on adults and juveniles
The following equations were used in the model:
Failed to parse (MathML with SVG or PNG fallback (recommended for modern browsers and accessibility tools): Invalid response ("Math extension cannot connect to Restbase.") from server "https://en.wikipedia.org/api/rest_v1/":): {\displaystyle Spawning = Spawning Adults * nrOf Eggs Randomly Generated }
Failed to parse (MathML with SVG or PNG fallback (recommended for modern browsers and accessibility tools): Invalid response ("Math extension cannot connect to Restbase.") from server "https://en.wikipedia.org/api/rest_v1/":): {\displaystyle SpawningAdults = Adults*0.22*0.4*0.5}
Spawning adults are calculated as 22 % of the population (the most recent data available), divided by 2 (according to research, BFT spawns every 2 to 3 years) and a coefficient of 0.4 was added to mimic the female population (due to higher mortality, there is less females than males). The number of eggs is not in millions but in thousands to not need to divide the result by 1000 to provide juvenile weight in metric tonnes (a young juvenile starts at around th weight of 1 kg).
Failed to parse (MathML with SVG or PNG fallback (recommended for modern browsers and accessibility tools): Invalid response ("Math extension cannot connect to Restbase.") from server "https://en.wikipedia.org/api/rest_v1/":): {\displaystyle Juveniles = (Spawning - Growth) * 12 }
Juveniles is the nmber of spawned times 12 (that is the amount of kgs grown in the first year of life).
Failed to parse (MathML with SVG or PNG fallback (recommended for modern browsers and accessibility tools): Invalid response ("Math extension cannot connect to Restbase.") from server "https://en.wikipedia.org/api/rest_v1/":): {\displaystyle Growth = Juvenile Mortality * Juveniles * 2 }
Juvenile mortality is randomly picked between 0.29 and 0.49. It is multiplied by 2 to mimic growth to adult size (BFT is considered an adult at around the weight of 24 kg).
Failed to parse (MathML with SVG or PNG fallback (recommended for modern browsers and accessibility tools): Invalid response ("Math extension cannot connect to Restbase.") from server "https://en.wikipedia.org/api/rest_v1/":): {\displaystyle Adults = Growth - Deaths}
Failed to parse (MathML with SVG or PNG fallback (recommended for modern browsers and accessibility tools): Invalid response ("Math extension cannot connect to Restbase.") from server "https://en.wikipedia.org/api/rest_v1/":): {\displaystyle Deaths = (Adult Mortality * Adults) + Legal Fishing + Illegal Fishing}
Adult mortality is set at 0.1 according to research.
Failed to parse (MathML with SVG or PNG fallback (recommended for modern browsers and accessibility tools): Invalid response ("Math extension cannot connect to Restbase.") from server "https://en.wikipedia.org/api/rest_v1/":): {\displaystyle Quota = 36 000 (variable)}
This number can be changed via the slider.
Failed to parse (MathML with SVG or PNG fallback (recommended for modern browsers and accessibility tools): Invalid response ("Math extension cannot connect to Restbase.") from server "https://en.wikipedia.org/api/rest_v1/":): {\displaystyle Legal fishing = Quota}
To simplify the model, fishing is set to the actual quota.
Failed to parse (MathML with SVG or PNG fallback (recommended for modern browsers and accessibility tools): Invalid response ("Math extension cannot connect to Restbase.") from server "https://en.wikipedia.org/api/rest_v1/":): {\displaystyle Illegal fishing = Quota * (0.3 - 1.5)}
Coefficient is randomly chosen based on numbers from research.
Therefore, the entire BFT population should be calculated as:
Failed to parse (MathML with SVG or PNG fallback (recommended for modern browsers and accessibility tools): Invalid response ("Math extension cannot connect to Restbase.") from server "https://en.wikipedia.org/api/rest_v1/":): {\displaystyle Population = Juveniles + Adults} Failed to parse (MathML with SVG or PNG fallback (recommended for modern browsers and accessibility tools): Invalid response ("Math extension cannot connect to Restbase.") from server "https://en.wikipedia.org/api/rest_v1/":): {\displaystyle Population = ((Adults*0.22*0.4*0.5 * nrOf Eggs Randomly Generated) - Juvenile Mortality * (Adults*0.22*0.4*0.5 * nrOf Eggs Randomly Generated))*12 + (Juvenile Mortality * Juveniles * 2 - (Adult Mortality * Adults) + Quota + Quota*coefficient) }
Stock and flow diagram model created in Vensim for the adult and juveniles point of view.
Whole population point of view
Failed to parse (MathML with SVG or PNG fallback (recommended for modern browsers and accessibility tools): Invalid response ("Math extension cannot connect to Restbase.") from server "https://en.wikipedia.org/api/rest_v1/":): {\displaystyle BFTsSpawned = EggsLaid/1000}
Failed to parse (MathML with SVG or PNG fallback (recommended for modern browsers and accessibility tools): Invalid response ("Math extension cannot connect to Restbase.") from server "https://en.wikipedia.org/api/rest_v1/":): {\displaystyle EggsLaid = SpawnableStock*(randomly chosen, 5 - 45 million)}
Failed to parse (MathML with SVG or PNG fallback (recommended for modern browsers and accessibility tools): Invalid response ("Math extension cannot connect to Restbase.") from server "https://en.wikipedia.org/api/rest_v1/":): {\displaystyle SpawnableStock = AdultBFTs/2}
Failed to parse (MathML with SVG or PNG fallback (recommended for modern browsers and accessibility tools): Invalid response ("Math extension cannot connect to Restbase.") from server "https://en.wikipedia.org/api/rest_v1/":): {\displaystyle AdultBFTs = BFTpopulation*0.22*0.4}
Failed to parse (MathML with SVG or PNG fallback (recommended for modern browsers and accessibility tools): Invalid response ("Math extension cannot connect to Restbase.") from server "https://en.wikipedia.org/api/rest_v1/":): {\displaystyle BFTpopulation = BFTsSpawned*12 - DeadBFTs}
Failed to parse (MathML with SVG or PNG fallback (recommended for modern browsers and accessibility tools): Invalid response ("Math extension cannot connect to Restbase.") from server "https://en.wikipedia.org/api/rest_v1/":): {\displaystyle DeadBFTs = AdultMortality + Fishing + Juvenile Mortality + IllegalCatches}
Failed to parse (MathML with SVG or PNG fallback (recommended for modern browsers and accessibility tools): Invalid response ("Math extension cannot connect to Restbase.") from server "https://en.wikipedia.org/api/rest_v1/":): {\displaystyle Quota = 36000(variable)}
Failed to parse (MathML with SVG or PNG fallback (recommended for modern browsers and accessibility tools): Invalid response ("Math extension cannot connect to Restbase.") from server "https://en.wikipedia.org/api/rest_v1/":): {\displaystyle Fishing = Quota}
Failed to parse (MathML with SVG or PNG fallback (recommended for modern browsers and accessibility tools): Invalid response ("Math extension cannot connect to Restbase.") from server "https://en.wikipedia.org/api/rest_v1/":): {\displaystyle Illegal catches=Quota*(random 0.3 - 1.5 coefficient)}
Failed to parse (MathML with SVG or PNG fallback (recommended for modern browsers and accessibility tools): Invalid response ("Math extension cannot connect to Restbase.") from server "https://en.wikipedia.org/api/rest_v1/":): {\displaystyle Adult Mortality = AdultBFTs*0.1}
Failed to parse (MathML with SVG or PNG fallback (recommended for modern browsers and accessibility tools): Invalid response ("Math extension cannot connect to Restbase.") from server "https://en.wikipedia.org/api/rest_v1/":): {\displaystyle JuvenileMortality = BFTsSpawned*12*(randomly chosen 0.29 - 0.41 coefficient)}
Vensim model focusing on the BFT population as a whole.
Results
The results have varied very strongly depending on the starting number of 1) juvenile population or 2) the selected population as a whole. Due to the fact, that the BFT population is marked as unknown in size in most sources a different tool might be more beneficial for this task. This might include the usage of random forests (as they were already used as a solution to the problem of biomass and mortality indexes [4]). Or perhaps the use of Monte Carlo for the initial starting points, yet there might be the issue of getting to the right data, because most BFT data are focused on the numbers of BFT caught and other statistics map only a selective part of the population, usually to provide scientific data about the behaviour, size and weight based information about the wild BFT stocks.
Conclusion
In conclusion, the BFT population is not in a healthy state. Most of the individuals are too young to reproduce and to make matters worse, juveniles are often caught by fishing boats, so they do not grown into adults to reproduce. Therefore, measures should be taken to prevent overfishing of the younger fish in order to provide a solid base for tuna reproduction in the future. The instilled quota are definately the way to go to preserve the remains of the species, yet the problem of illegal tuna fishing should be addressed. Unfortunately, the black market with BFT will continue unless the demand for tuna meat will drop. So the fate of BFT is also partly in the hands (or stomachs) of the consumers, who decide whether they will demand more delicious tuna meat for sushi and other dishes, in order to help preserve this graceful and swift species. Another aspect, is of course, the tuna fishing lobby, that is trying to keep the tuna quota as high as possible, ignoring the advice of scientists to lower quota quite dramatically, but that is still in correlation with the profit obtained from selling tuna meat.
Citations
[1] ANONYMOUS. Bluefin tuna (Thunnus thynnus). Fisheries - European Commission [online]. 16. září 2016 [vid. 2020-01-18]. Dostupné z: https://ec.europa.eu/fisheries/marine_species/wild_species/bluefin_tuna_en
[2] LEMOS, Erini. Sustainability of Atlantic Bluefin Tuna Stocks: The Problem of Overfishing. 5.
[3] FROMENTIN, Jean-Marc a Joseph E POWERS. Atlantic bluefin tuna: population dynamics, ecology, fisheries and management. Fish and Fisheries [online]. 2005, 6(4), 281–306. ISSN 1467-2960, 1467-2979. Available at: doi:10.1111/j.1467-2979.2005.00197.x
[4] RAVIER, C. Long-term fluctuations in the eastern Atlantic and Mediterranean bluefin tuna population. ICES Journal of Marine Science [online]. 2001, 58(6), 1299–1317. ISSN 10543139. Available at: doi:10.1006/jmsc.2001.1119
[5] CORT, José L. a Pablo ABAUNZA. (PDF) The impact of massive fishing of juvenile Atlantic bluefin tunas on the spawning population (1949-2010). ResearchGate [online]. [vid. 2020-01-18]. Available at: https://www.researchgate.net/publication/309213107_The_impact_of_massive_fishing_of_juvenile_Atlantic_bluefin_tunas_on_the_spawning_population_1949-2010
[6] FROMENTIN, Jean-Marc a Laurence T KELL. Consequences of variations in carrying capacity or migration for the perception of Atlantic bluefin tuna ( Thunnus thynnus ) population dynamics. Canadian Journal of Fisheries and Aquatic Sciences [online]. 2007, 64(5), 827–836. ISSN 0706-652X, 1205-7533. Available at: doi:10.1139/f07-050
[7] SISKEY, M. R., M. J. WILBERG, R. J. ALLMAN, B. K. BARNETT a D. H. SECOR. Forty years of fishing: changes in age structure and stock mixing in northwestern Atlantic bluefin tuna (Thunnus thynnus) associated with size-selective and long-term exploitation. ICES Journal of Marine Science [online]. 2016, 73(10), 2518–2528. ISSN 1054-3139. Available at: doi:10.1093/icesjms/fsw115
[8] ICCAT. Report of the standing committee on research and statistics. In: [online]. 2010 [vid. 2020-01-19]. Available at: https://www.iccat.int/Documents/Meetings/Docs/2010_SCRS_ENG.pdf
[9] HERRMANN, Richard. Science-based management will ensure a healthy future. 8.
[10] FROMENTIN, Jean-Marc, Sylvain BONHOMMEAU, Haritz ARRIZABALAGA a Laurence T. KELL. The spectre of uncertainty in management of exploited fish stocks: The illustrative case of Atlantic bluefin tuna. Marine Policy [online]. 2014, 47, 8–14. ISSN 0308597X. Available at: doi:10.1016/j.marpol.2014.01.018
[11] Bluefin Tuna | Species | WWF. World Wildlife Fund [online]. [vid. 2020-01-20]. Available at: https://www.worldwildlife.org/species/bluefin-tuna
[12] State of Tuna Stocks Worldwide Assessed in Comprehensive ISSF Report | International Seafood Sustainability Foundation [online]. [vid. 2020-01-19]. Available at: https://iss-foundation.org/state-of-tuna-stocks-worldwide-assessed-in-comprehensive-issf-report-2/
[13] Maps: Global Tuna Management [online]. [vid. 2020-01-20]. Available at: http://pew.org/2yHtaL7
[14] ICCAT. Draft recommendation by ICCAT establishing multi-annual management plan for bluefin tuna in the eastern atlantic and the mediterranean [online]. [vid. 2020-01-20]. Available at: https://www.iccat.int/com2018/ENG/PA2_605_ENG.pdf
